


Feb 11 | 9 min read
Introducing a Datadog-compatible HTTP API

Point your Datadog Agent to Opstrace
Our goal is to make it as easy to use Opstrace for everyone as possible. Recently, we have started working on a Datadog-compatible HTTP API implementation for Opstrace. The groundwork for this is done and is available now in our main branch.
What we have today should be looked at as a 'preview' in the spirit of sharing early and often. We would love to get your help to start testing the API in the wild, and of course, to get your feedback about which aspects you would like to see implemented next.
We believe a good way to show the concepts and the current state is to share a tutorial with you!
Here we go.
Overview
In this walkthrough, we are first going to install Opstrace in an AWS account.
We are then going to launch a Datadog (DD) agent on our local machine and configure it to send metrics to Opstrace — through the Internet via a secured connection.
Next up, we are going to use a system monitoring dashboard (by default bundled with Opstrace) in order to confirm that data is indeed incoming.
Finally, we are going to synthetically generate custom application metrics on our local machine. We are going to push them via the StatsD protocol to the StatsD server of the local DD agent, and then do a few brief plotting exercises to confirm that these custom application metrics end up being queryable from Opstrace.
Opstrace setup
This section briefly shows how we installed Opstrace for this tutorial.
We downloaded and extracted the latest Opstrace CLI as described in our
quick start guide. We named this cluster datadogdemo and
created it in our AWS account with the following command:
$ ./opstrace create aws datadogdemo -c config.yaml...2021-02-10T14:32:53.889Z info: write api token for tenant default to file tenant-api-token-default2021-02-10T14:32:53.891Z info: write api token for tenant system to file tenant-api-token-system...2021-02-10T15:00:22.492Z info: cluster creation finished: datadogdemo (aws)2021-02-10T15:00:22.492Z info: Log in here: https://datadogdemo.opstrace.io
Note the command output; it refers to the file tenant-api-token-default. We
are going to make use of that file below.
The cluster configuration file we used was:
$ cat config.yamltenants:- defaultnode_count: 3
If you are curious, the cluster configuration parameters are documented here, and the concept of tenants is documented here.
Configure and start the DD agent on your machine
Now let us launch a Datadog agent on our local machine, in a Docker container.
Before doing that, we set two environment variables:
export DD_DD_URL="https://dd.default.datadogdemo.opstrace.io"export DD_API_KEY="$(cat tenant-api-token-default)"
One is for specifying the URL to the DD API provided by our Opstrace cluster.
The other is for specifying the appropriate authentication token: the Opstrace
cluster accepts only authenticated HTTP requests by default. Note that the
authentication token was written out as a file by the create command above.
Note that the URL https://dd.default.datadogdemo.opstrace.io is
tenant-specific. In this case, it represents the DD API endpoint for the tenant
with the name default — which was specified in the cluster configuration file
above.
As we configured it, Opstrace exposes its API endpoints securely via HTTPS, using TLS certificates derived from the Let's Encrypt staging environment. That certificate authority is not automatically trusted by system certificate stores. To establish trust, download the Let's Encrypt staging root CA to the current working directory:
wget https://letsencrypt.org/certs/fakelerootx1.pem
Note: for production deployments, Opstrace can easily be configured to expose
browser-trusted TLS certificates: upon cluster creation, set the configuration
parameter cert_issuer to the value letsencrypt-prod, see
docs.
Now we're ready to launch the Datadog agent:
docker run -it \--net=host \-v $(pwd)/fakelerootx1.pem:/etc/ssl/ca-bundle.pem \-v /var/run/docker.sock:/var/run/docker.sock:ro \-v /proc/:/host/proc/:ro \-v /sys/fs/cgroup/:/host/sys/fs/cgroup:ro \-e DD_API_KEY="${DD_API_KEY}" \-e DD_DD_URL="${DD_DD_URL}" \gcr.io/datadoghq/agent:7
Remarks about this command:
- The Let's Encrypt trust anchor is mounted into the container (to a location
automatically discovered by the Golang HTTP client). Note that the
docker runcommand will not fail in an obvious way when the filefakelerootx1.pemis not present in the current working directory — so please double-check! - The container is launched in "host" networking mode. That allows it to receive
StatsD packages sent to the host's loopback interface at
127.0.0.0:8125. Make sure no other service is listening on this port on the host. - The Opstrace URL and credentials are injected into the container via the
environment variables
DD_API_KEYandDD_DD_URLdocumented here. - This starts the DD agent interactively and therefore shows its output in the
terminal. Leave the agent running for as long as you'd like. By the end of
this walkthrough, you can terminate it with
Ctrl+C.
Confirm data ingest via system dashboard
Each Opstrace installation by default comes with a tenant called system that
it uses for monitoring itself.
In the system tenant's Grafana instance exposed at
https://system.<opstrace-name>.opstrace.io/grafana/ you can find and open a
dashboard called DD API / Overview. It does not show much yet, but it is
already sufficient to confirm that data is indeed incoming, pushed by the DD
agent launched above.
Here is a screenshot:

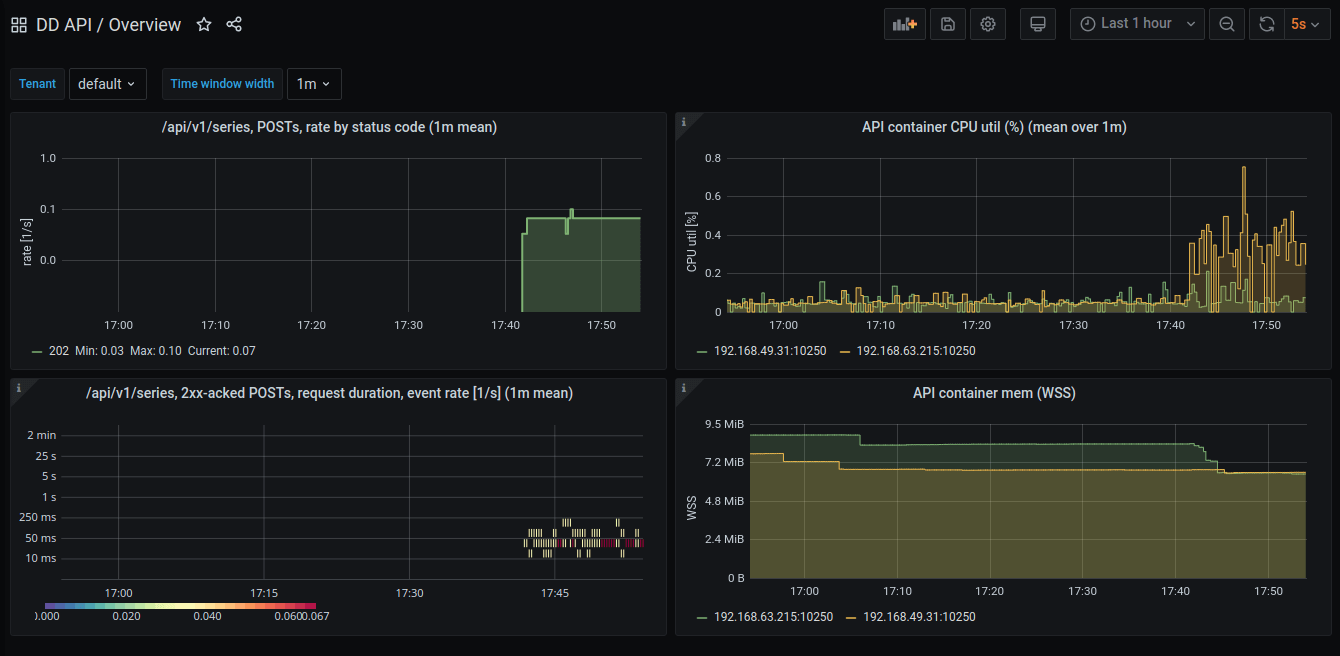
The top-left panel shows that HTTP POST requests are incoming at the default
tenant's DD API endpoint at a rate of roughly one POST request per ten seconds.
Each of these requests is acknowledged with status code 202. That means that
the Opstrace DD API implementation accepts the incoming data. That is all we
need to see for now!
A peek into system metrics collected by the DD agent
The DD agent collects and sends a number of metrics about the host system it is running on. For example, it measures the amount of data transmitted by specific network devices.
The hostname of the machine we used for this tutorial is x1carb6. One of the
network devices in this machine is called enp0s31f6.
Let us use the "Explore" view of the default tenant's Grafana instance
(exposed at https://default.<opstrace-name>.opstrace.io/grafana/) to look at
the incoming data rate on the above network device.
With only one DD agent pushing data, the Prometheus query expression can be as simple as
system_net_bytes_rcvd{device="enp0s31f6"}
Here is how the resulting plot looked like in our example:

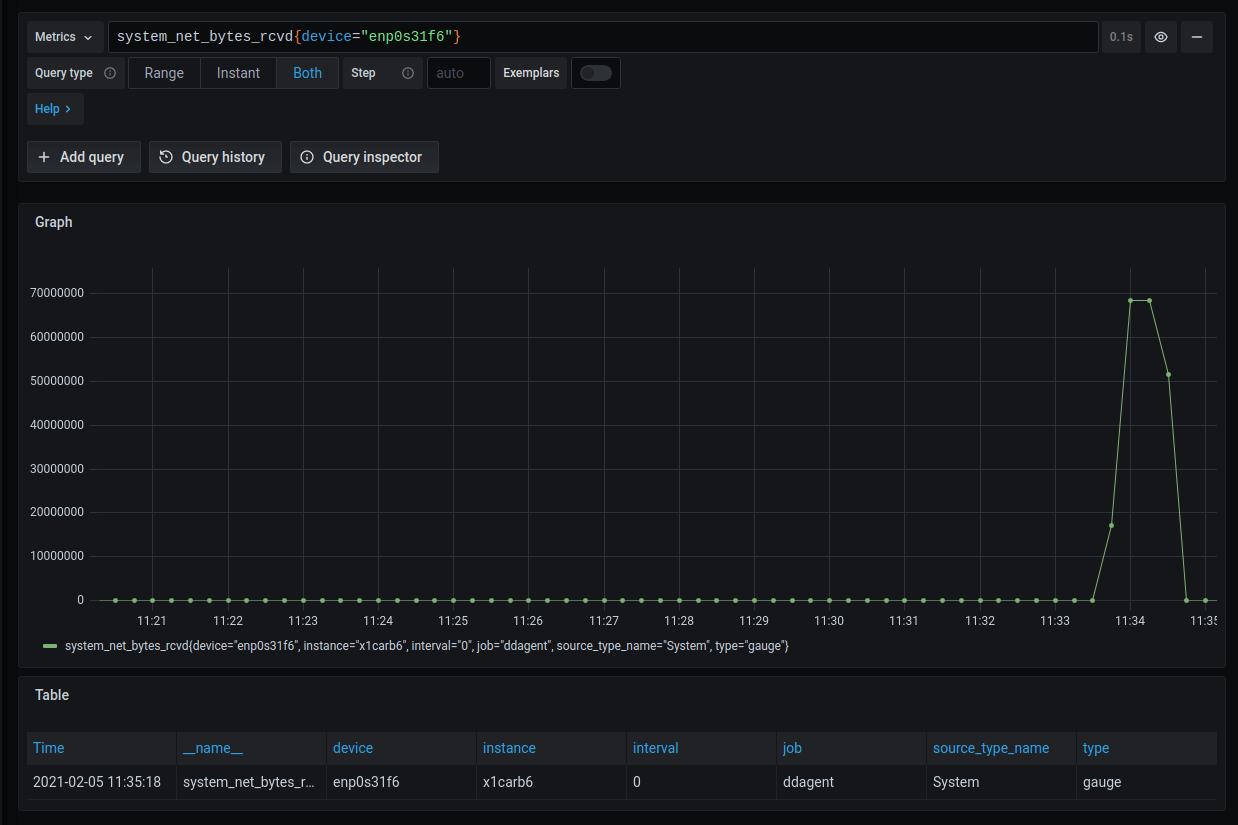
Some interesting aspects to note:
- The name of this metric is hard-coded by the Datadog agent. Despite the name
(which suggests an absolute number of bytes received), the values actually
have the unit
Bytes/s. That is documented here. - The hostname appears as a metric label; see
instance="x1carb6"right below the plot. - Each metric ingested via the Opstrace DD API gets the label
job="ddagent". - Although the value we are looking at here semantically is a rate, the DD agent
sets
type="gauge"— that might be confusing for people that know that the DD agent also supports metrics of typerate, but is entirely fine.
Send custom application metrics
Here, we are using a CPython program to synthetically generate custom StatsD
application metrics; one of type Counter and one of type Histogram.
This is the program we have used:
import timeimport randomimport datadog as dddd.initialize({"statsd_host": "127.0.0.1", "statsd_port": 8125})while True:# Generate a value ~5 times per second.## Generate from a synthetic, asymmetric distribution:# Value 1, with a probability of 0.1# Value 2, with a probability of 0.6# Value 3, with a probability of 0.3## The expectation value of this distribution is:# >>> (1 * 1 + 2 * 6 + 3 * 3) / 10# 2.2r = random.random()if r < 0.1:value = 1elif r < 0.7:value = 2else:value = 3dd.statsd.histogram("blog.app.testhist", value)# Increment a counter by +2 in each loop iteration,# i.e. at a rate of 5 Hz. The expected increment is# therefore 10 per second.dd.statsd.increment("blog.app.testcounter", 2)time.sleep(0.2)
We have put this into send-statsd-metrics.py and then executed
python3 send-statsd-metrics.py in a new terminal (just leave this running and
Ctrl+C when you are done with this tutorial).
You should be able to launch this on any modern CPython 3.x release after
running pip install datadog.
Query custom application metrics
Let us use the "Explore" view of the default tenant's Grafana instance
(exposed at https://system.datadogdemo.opstrace.io/grafana/) to look at these
two custom metrics:

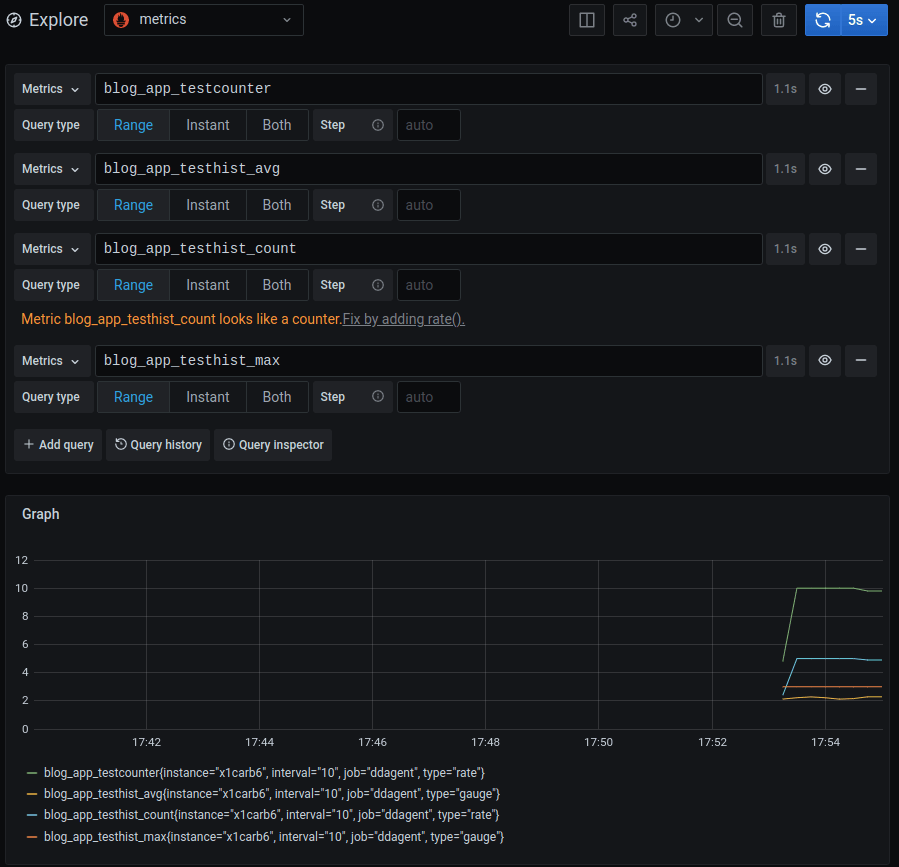
Here is what we see:
- The
Countermetric we emitted under the StatsD nameblog.app.testcounterappears under the Prometheus metric nameblog_app_testcounter. The value is roughly 10 per second. That is, the DD agent translated this StatsD counter into a rate, and therefore also attached the labeltype="rate". Hence, there is a bit of conflict here between the name of the metric (suggesting "counter") and the meaning of the number (a rate). This is an important aspect to understand. - The
Histogrammetric we emitted under the StatsD nameblog.app.testhistresults in just a handful of aggregates:max,median,avg, andcount(this can be changed via the Datadog agent config). Here, we are plottingmax,avg, andcountto confirm that the actual numbers make sense. In particular, as expected, the_maxgauge is3.0(the largest value from the distribution), and the_avggauge fluctuates around the expectation value of the distribution, which is2.2.
You can find more detail about all this in our GitHub issue 339.
Outlook
Looking forward, we are going to build support for service checks and integrate with our Opstrace alerting capabilities.
The long-term goal is that you can simply point your Datadog agent(s) at Opstrace and get a lot of the powerful functionality you're used to from Datadog, for cost that is not dependent on the volume of data you send.