


Jun 1 | 8 min read
Dynamic per-tenant Cortex limits, configurable via UI
How to change rate limits on the fly via UI
Introduction
Cortex has a runtime configuration system which can be used to change configuration parameters on the fly without restarting individual components. This is a powerful feature. For example, it allows for dynamically changing bandwidth limits on a per-tenant basis.
In Opstrace, we have now started to expose the set of Cortex runtime configuration parameters via our graphical user interface.
In this blog post, I am going to briefly demonstrate how to use this new Opstrace capability: we are going to walk through changing a certain rate limit in a running Opstrace system, and we are making sure that we see the change take effect using a tiny load test performed twice -- before and after the configuration change.
Along the way, I try to explain some of the relevant concepts.
Step-by-step guide: how to use the new Cortex configuration UI
In Opstrace, the Cortex ingestion rate limit is currently set to 10^5 samples per second per tenant per distributor. Note that this is more or less an arbitrary choice for now, and therefore it makes sense for our users to be able to change this to their needs in a rather easy fashion.
In this walkthrough, I will first demonstrate this limit to take effect when sending metric samples at a high rate. Then, I will reduce the limit to make it much more strict and repeat the load test to see the new setting take effect.
1) Observe load response with default rate limits
In the Opstrace UI, I navigated to Configuration -> Cortex to display the
current Cortex (runtime) configuration for a specific tenant, named default.
The following screenshot shows a tiny part of that config:

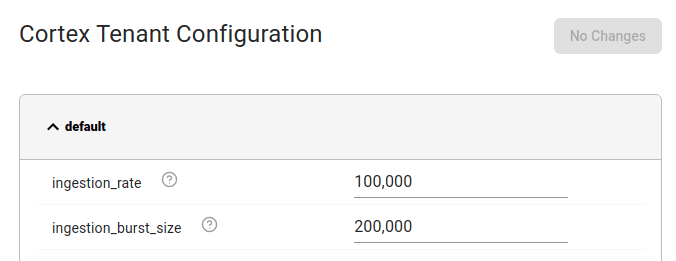
The first row, ingestion_rate, shows the above-mentioned ingestion rate limit
of 10^5 samples per second per tenant per distributor.
Next up, I pushed metric samples at a high rate into the system (using our in-house testing tool called 'looker', cf. Appendix below for the specific command used). I monitored the system response with our "Tenant Overview" dashboard for Cortex (rather prominently shown in the Opstrace UI). The following screenshot shows some of the panels in this dashboard:

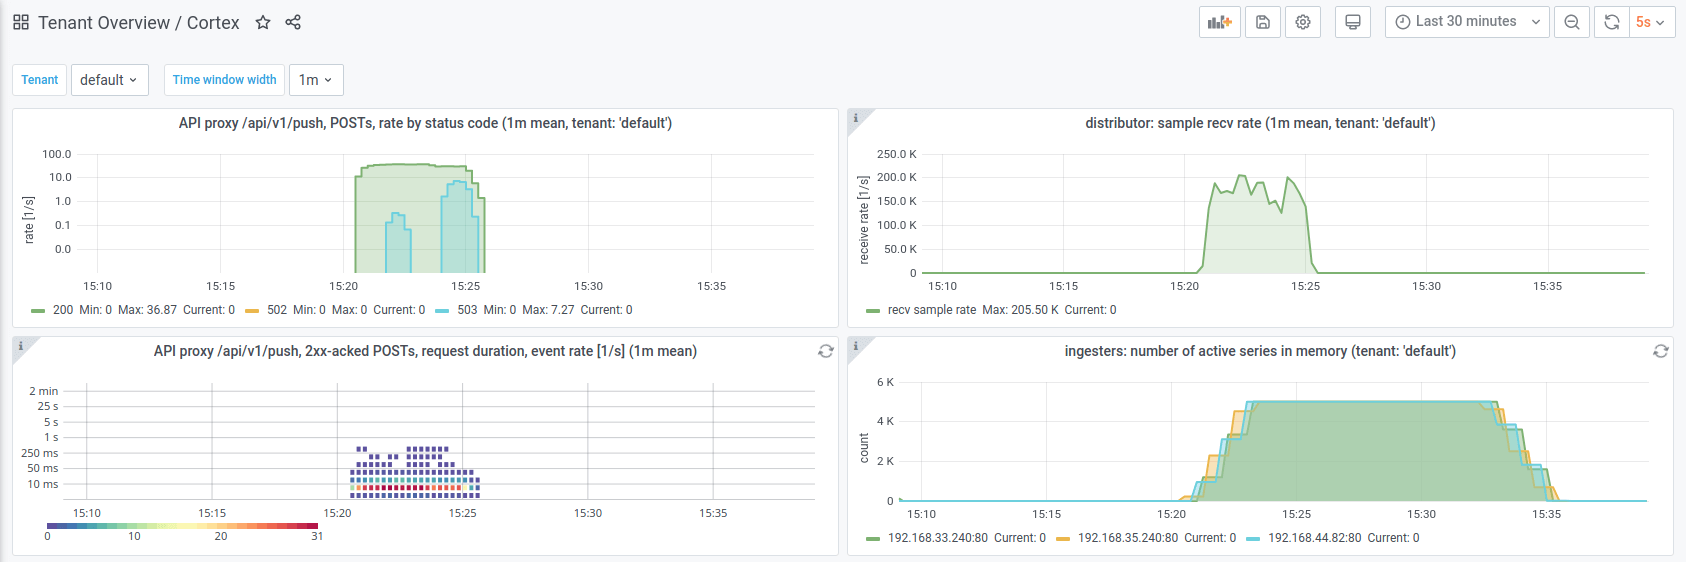
Note that this system was comprised of three Cortex distributors, yielding a
maximum allowed sample push rate of 3*10^5 samples per second. In the
top-right panel of the screenshot above, we can see that the one-minute time
average of the actual sample push rate during the short load test maxed out at
approximately 2*10^5 samples per second. That is, the limit defined by
ingestion_rate was not reached continuously, at all times. However, on
shorter time scales, it was reached every now and then: individual distributors
sometimes rejected individual push HTTP requests for reaching the said limit.
These cases can be identified when inspecting the HTTP response body. Example:
ingestion rate limit (100000) exceeded whileadding 5000 samples and 0 metadata
Side note: in Opstrace,
we translate Cortex' HTTP
responses with status code 429 to HTTP responses with status code 503 because up
until recently, the Prometheus remote_write system did not retry in view of
429 responses. Likewise, the top-left panel in the screenshot above shows a low
rate of 503 responses (watch out for the semi-logarithmic scale here).
The sample receive rate panel shown in the top-right corner of the screenshot above is based on the distributor's perspective. It includes samples before rejection (i.e., before enforcing rate limits).
Let us have a look at the sample receive rate from the ingester system's point of view. This is after rejection, and therefore reflects the actual sample ingest rate after enforcing rate limits.

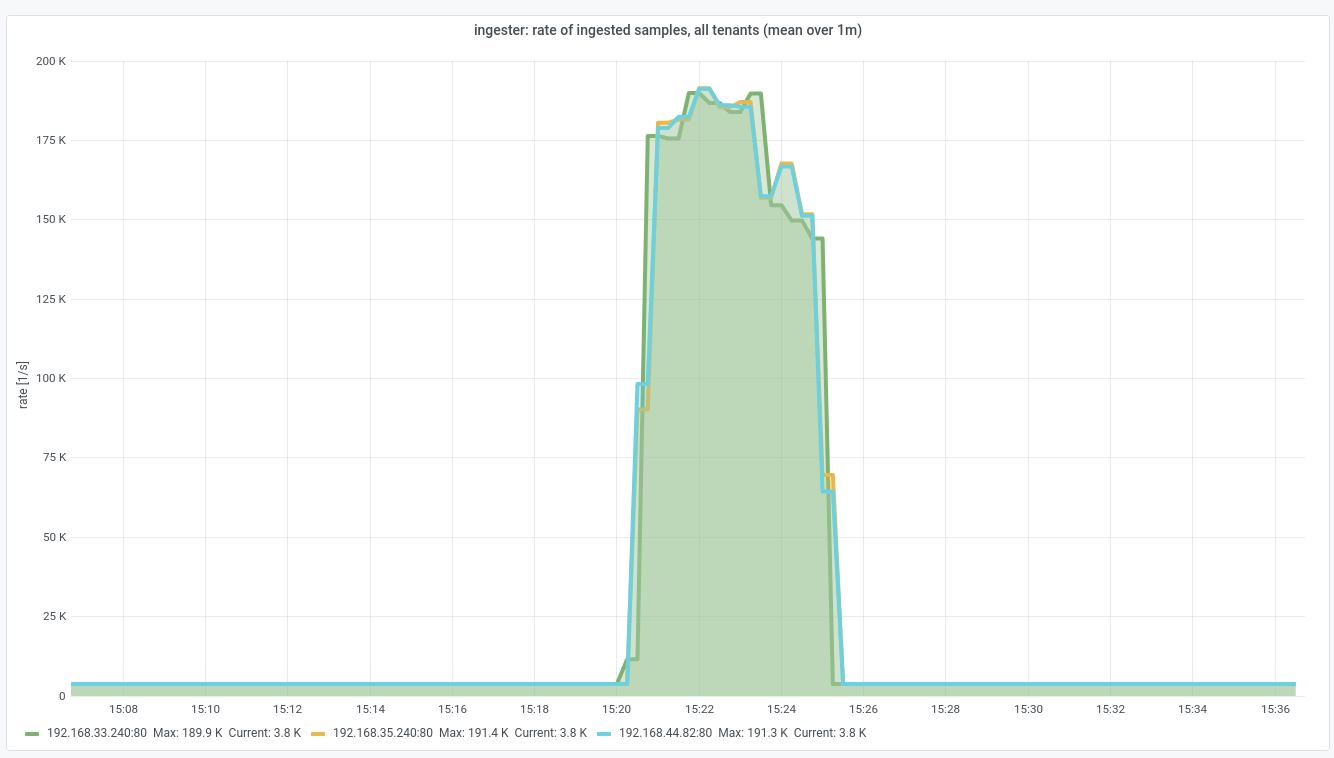
Note that this metric shows the sample ingest rate for all tenants in sum, from
the point of view of each individual ingester. In the plot, you can convince
yourself that there is a negligible base ingest rate (created by the system
tenant of this Opstrace instance); the profile of the peak in the graph shown is
dominated by said short load test.
Side note: in this Opstrace instance, the distributor replication factor is set to three. That is, each of the three distributors forwards to three ingesters -- which is why the ingest rate as seen by the ingesters is effectively three times as large as what the user/tenant pushes.
The plot shows that each of the ingesters saw a maximum sample push rate of
slightly below 2*10^5 samples per second. This is a little lower than what was
reported by the distributors before: because some of the HTTP requests were
actually rejected as of the discussed rate limit hitting in.
A noteworthy conclusion from these observations is that the sample ingest rate
bottleneck in this tiny experiment was not at all times the ingestion_rate
limit, but elsewhere (probably on client side). It is fair to say that the
ingestion_rate did kick in, but only sometimes.
Next up, I am going to significantly reduce the rate limit. The goal is to make it the definite bottleneck when repeating the short load test.
2) Decrease ingest rate limit via UI
I again navigated to the new Cortex configuration section in the Opstrace UI and
changed the ingestion_rate limit for the default tenant:

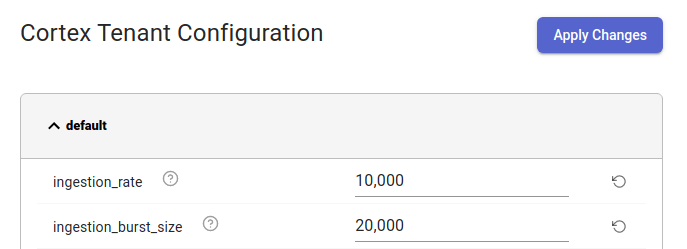
As you can see, I reduced the ingestion_rate limit by an order of magnitude to
10^4 samples per second per distributor. I pressed Apply Changes and waited
a minute for the changes to apply.
Note: this change needs to propagate through a small number of caching layers where some of them have to periodically poll (instead of responding to changes instantaneously). The upper bound for how long it takes until these config changes apply in every corner of the system is on the order of one minute, for now.
3) Observe load response after configuration change
With the new limit in place, I repeated the short load test.
In order to see how the system behaved during this test, let's first have a look at the Tenant Overview dashboard for Cortex:

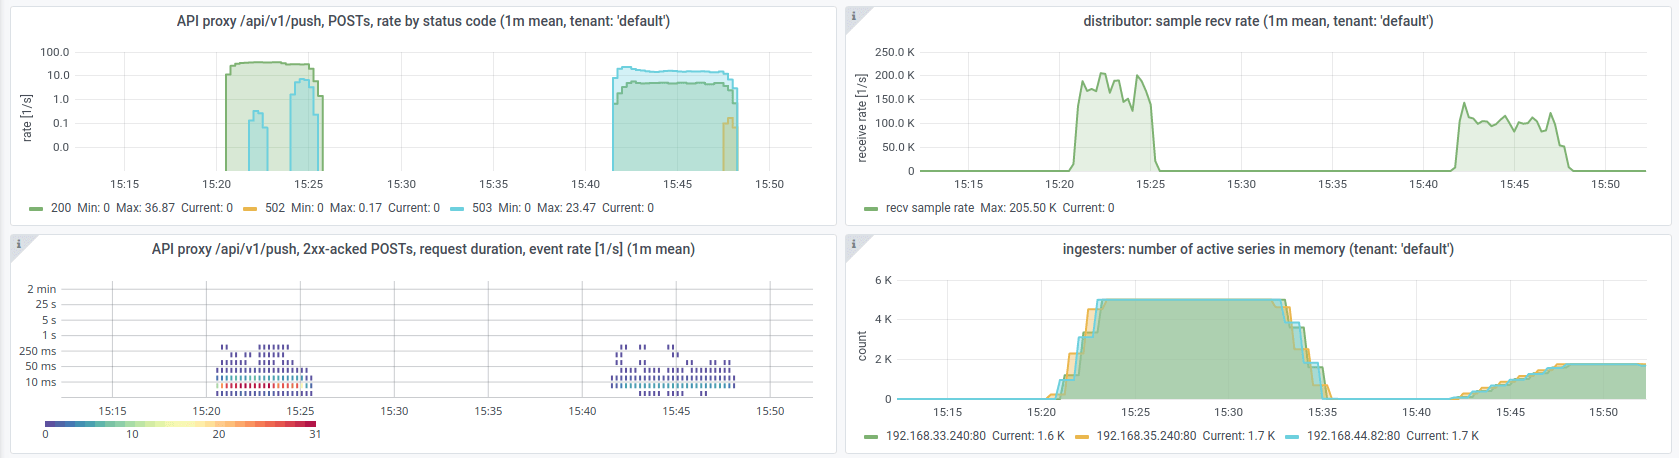
Each panel shows data from both experiments: the previous load test as well as the more recent one after the configuration change.
You can see in the top-left panel that the rate of HTTP responses with status code 503 (as of the new rate limit hitting in) was higher than the rate of HTTP responses with status code 200 (indicating 'data accepted'). That already shows a strong throttling effect.
The top-right panel shows almost the same sample receive rate as before. Why is that? Again, this is the sample receive rate before applying rate limits (before "rejection", as reported by the distributors).
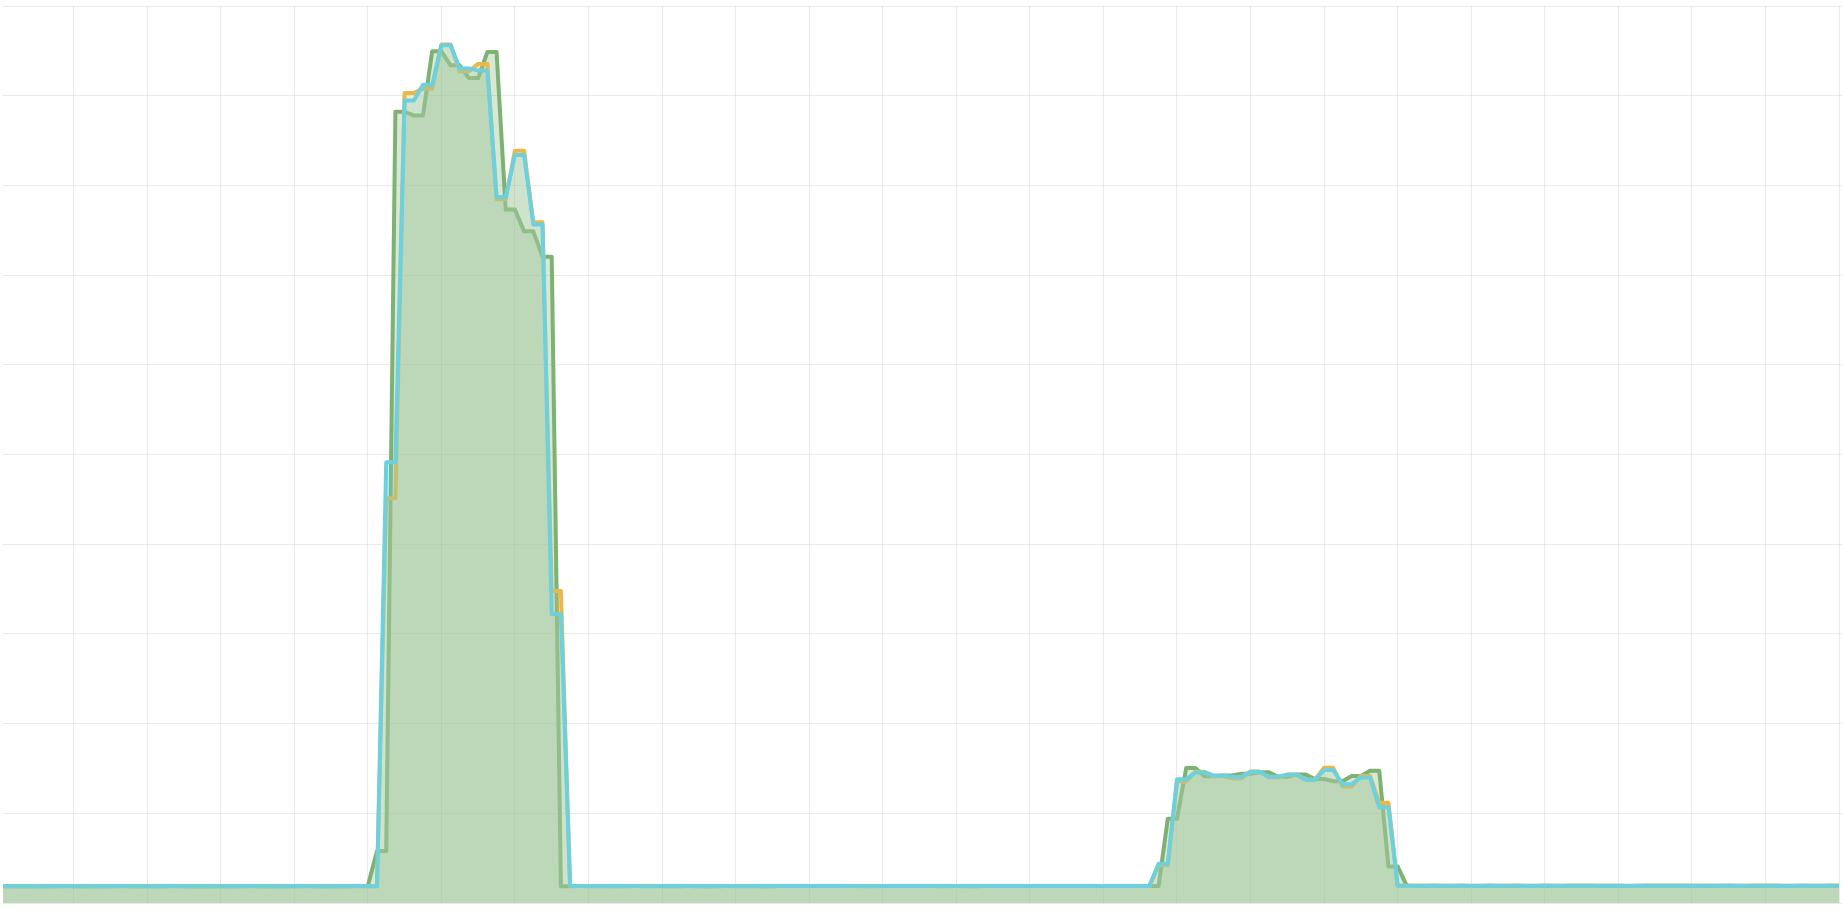
Let's have a look at the actual sample ingest rate (after rejection),as reported by the ingesters:

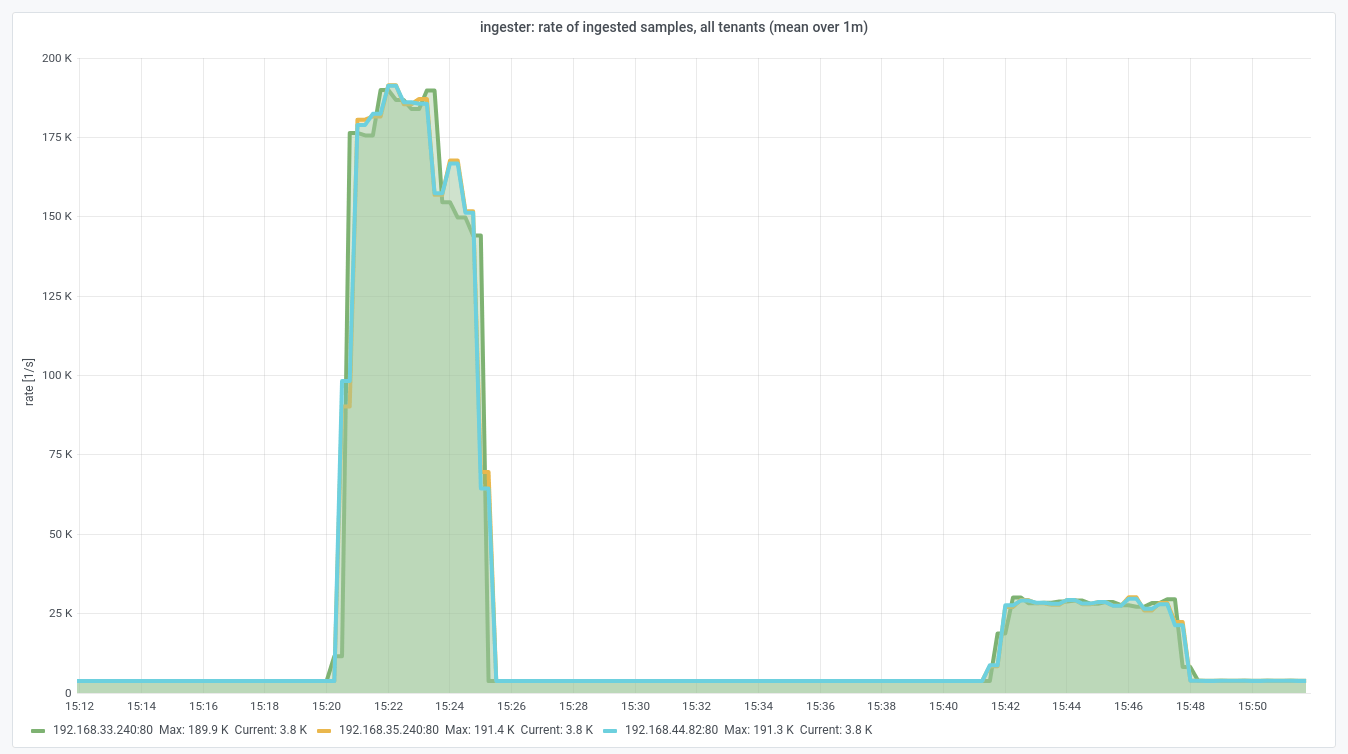
In the small peak on the right-hand side in this graph, we now see a rather
stable equilibrium where each ingester accepted approximately 3*10^4 samples
per second. This directly corresponds to the new ingestion_rate limit of
10^4 samples per second per each of the three distributors.
As per the observations above, in this second load test, the actual sample
ingest rate was at all times limited by the ingestion_rate throttling
mechanism. As desired, this throttling mechanism became the definite bottleneck
after the config change.
Final remarks
In this post, I focussed on explaining and dynamically changing Cortex'
ingestion_rate parameter. You may want to explore all the other Cortex runtime
configuration parameters that you can change dynamically for each tenant
individually; among them is for example an upper limit for the number of active
time series.
You will notice that there are still rough edges around what we have built here. Like a lot of what we do, this is very much to be considered a prototype, and the screenshots in this blog post will likely become out of date sooner than later.
However, I hope that it has become apparent that changing a certain rate limit for an individual tenant in a running Opstrace system is just a button click away. From a system operations point of view, this is an incredibly powerful feature. We have work underway to help choose sensible rate limits. However, for you to be able to change and tweak them in an ad-hoc and maybe even playful fashion is always going to be priceless -- that is why we wanted to get this feature to our users as early as possible.
Besides the per-tenant configuration, there also are global settings that can be changed in Cortex on the fly, such as global ingester rate limits. The corresponding parameters are not yet exposed via our UI, but will be soon.
Appendix
The command used for generating load:
$ docker run -v $(pwd):/rundir --net=host \opstrace/looker:17b792dd-ci looker \https://cortex.default.${CLUSTERNAME}.opstrace.io \--metrics-mode \--bearer-token-file tenant-api-token-default \--n-concurrent-streams 5000 \--n-entries-per-stream-fragment 5000 \--stream-write-n-seconds 120 \--metrics-time-increment-ms 1 \--max-concurrent-writes 200 \--max-concurrent-reads 200 \--n-cycles 1