


Jan 29 | 7 min read
Pulling back the curtain on monitoring cost
Simão Reis

Providing transparency on monitoring spending
An all-too-common pain point that inspired the creation of Opstrace is the ever-increasing, high cost that observability platforms burden you with. Adding insult to injury, this typically comes with little-to-no visibility into where your spending actually goes… until you get a surprise bill at the end of the month, which cascades into an internal scramble to control what data you’re ingesting. In this post, we will explain our pricing motivation and pull back the curtain on exactly where infrastructure spend for Opstrace goes.
At its core, solving this problem is one of aligning incentives. We want to be incentivized to help you meet your goals, rather than incentivized to resell and markup the cost of storage and network. Therefore, we specifically choose to align ourselves with our customers by charging for the value you and your team get from our product, rather than charging for the volume of data created by your products. What you pay for the data you generate should be between you and your cloud provider; when you run Opstrace in your cloud you pay your vendor directly for the underlying infrastructure to ingest, query, and store your data (leveraging any discounts you have already negotiated). If you choose to use our open source version then that is the entirety of what you pay for Opstrace. But should you want additional enterprise features—such as configurable SSO, fine-grained authz, custom domains, etc.—then our commercial version is for you. (More on this in another blog post.)
In this blog post, our goal is to be completely transparent and show you how to determine exactly how much Opstrace costs for metrics ingestion and storage. By the end, you should be able to manually reproduce our results for yourselves. Subsequent blog posts will address other characteristics of the total cost of ownership, and longer-term as we publicly iterate with you on these analyses, we plan to build reporting, prediction, and optimization recommendations into the product as a first-class feature so these sorts of manual investigations are never needed again. Pricing for cloud expenditures is often confusing at best and intentionally obfuscated at worst. For today, we endeavor to pull back that curtain and discover the “right” numbers, not show numbers that look right.
“A secure, highly-available, horizontally scalable Prometheus API, ingesting 1M active series with 18-month retention is less than $30 per day.”
To determine the complete picture of Opstrace metrics ingest cost we set up a long-running test. Our goal was to create a baseline steady state that anyone can reason about, and around which we can experiment further. The test was relatively simple—generate a dummy metrics workload and send that to Opstrace:

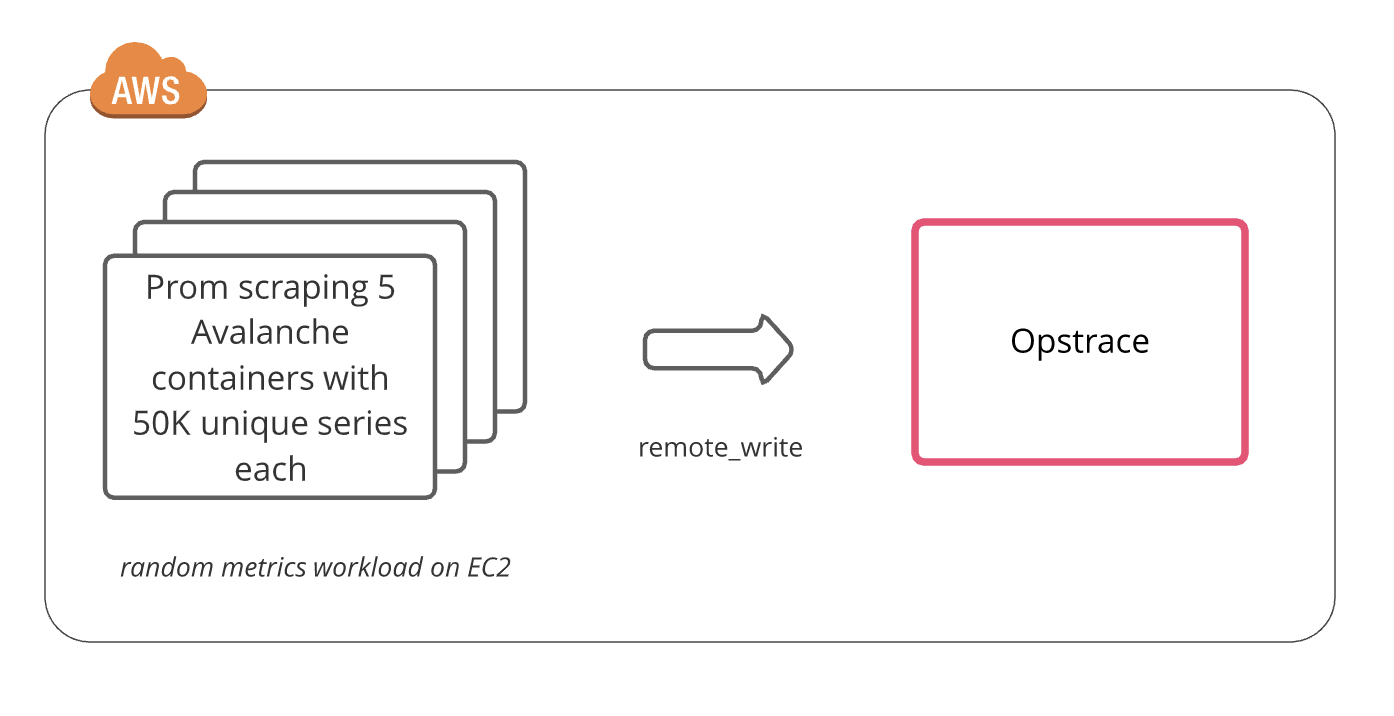
All to-be-monitored workloads have characteristics that can impact ingestion and storage behavior. The main characteristics we addressed are the total number of time series and data points per minute (DPM)—generating 1M unique active metric series and scraping them every 15 seconds. The workload we generated was relatively stable with no metric churn or spikes. To accomplish this we chose Avalanche, a random metric generator that exposes a Prometheus-formatted metrics endpoint based on some configuration
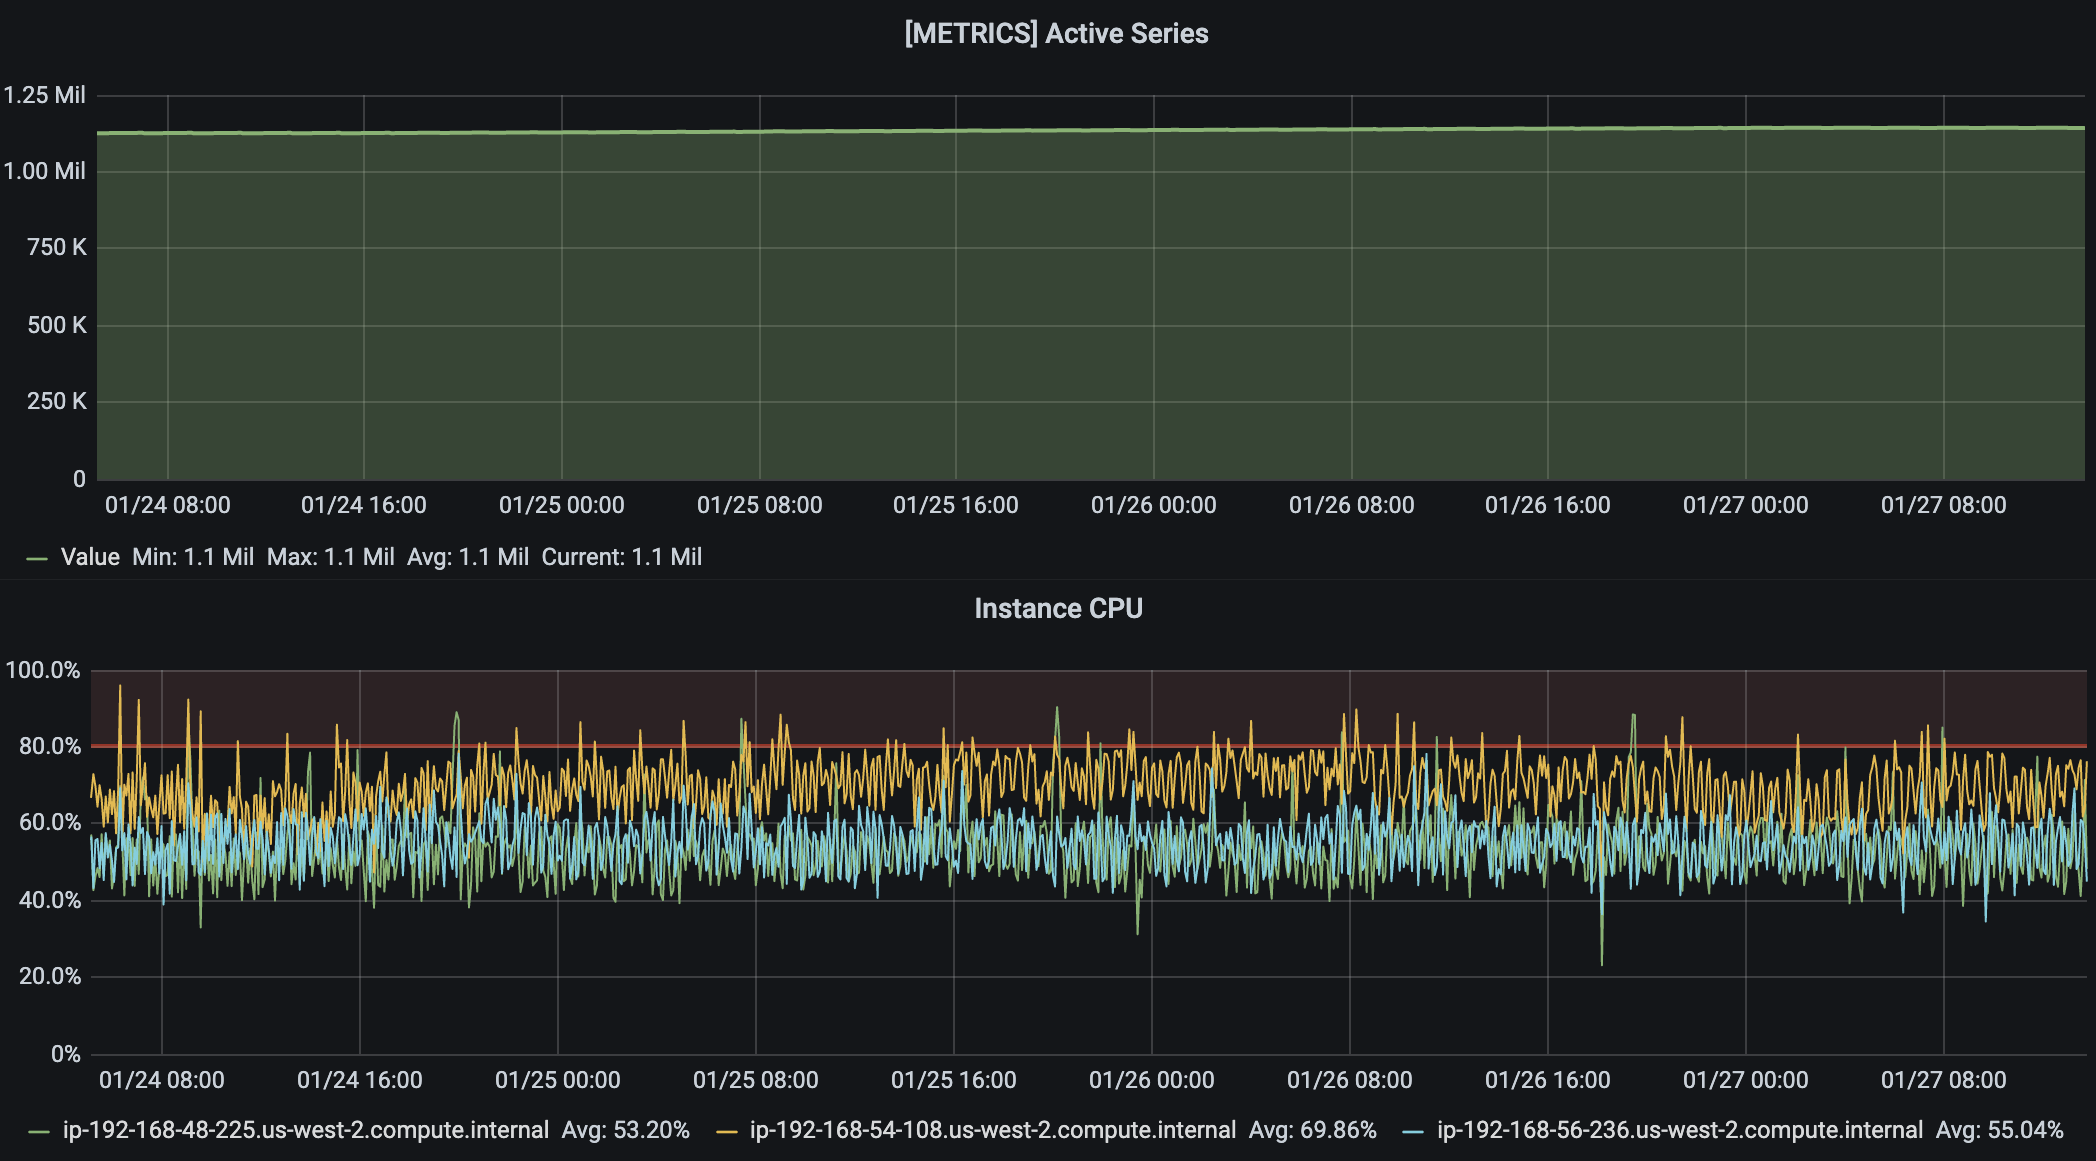
[1]. Twenty instances of these metrics generators were spread across four standalone EC2 instances (in the same region Opstrace was installed in). Each EC2 instance had a local Prometheus scraping the metrics endpoints every 15 seconds and remote writing to Opstrace [2][3].We achieved the smooth baseline we were shooting for. We observed a comfortable steady-state operation with no ingest errors and ~20% headroom (unused resources to expand into to handle unpredictability) [4]. Ingest is primarily CPU bound, so this is a reasonable proxy for ingest capacity.

We inspected the AWS usage and cost data for every resource provisioned by Opstrace. We adjusted the data with some assumptions, starting with using 1-year no-up-front reserved instances list price, even though we used on-demand for the test. This provides ~30% savings and would be how you’d want to run this in production. We also extrapolated the storage cost from the daily growth rate to an 18-month retention period (i.e., as if we were already storing 18 months of data in S3), but we did not account for any potential Cortex compaction impacts
[5].
In the end, we conclude that Opstrace—a secure, highly-available, horizontally scalable Prometheus API—collecting 1M active series with an 18-month retention period is less than $30 per day [6]. A drop in the bucket compared to what the applications you’re observing cost and ~10x cheaper than Datadog for the same volume of data
This analysis of the ingest and storage cost of metric time series is hopefully straightforward and transparent. Nothing is intended to be hidden or obfuscated because we have no incentive to do so. Quite the opposite! In the near future, we will do additional blog posts about other aspects of cost as we work toward our ultimate goal of building this transparency into our product as a first-class citizen. We hope you’ll let us know what you think of this in our community and subscribe to our newsletter. You can also reply to us on Twitter.
If you haven't already, try out Opstrace for yourself by installing it using our quick start.
Seb, Simao, Chris
[1] Details on dummy metrics workload.
If you are so inclined, you can inspect the output from Avalanche locally, using the same configuration we used in the test:
$ docker run -p 9001:9001 quay.io/freshtracks.io/avalanche:latest --labelname-length=15 --metricname-length=15 \--label-count=10 \ # unique label names and values--metric-count=25000 \ # unique metric names--series-count=2 \ # number of unique series (unique set of labels)--metric-interval=604800 \ # cycle metric name every 7d--series-interval=604800 # cycle series every 7dServing ur metrics at localhost:9001/metrics
Visiting localhost:9001/metrics with your browser or curl you will find
25,000 pairs of rows that look like this:
avalanche_metric_mmmmmmmmmmmmmmm_0_0{cycle_id="0",label_key_kkkkkkkkkkkkkkk_0="label_val_vvvvvvvvvvvvvvv_0",label_key_kkkkkkkkkkkkkkk_1="label_val_vvvvvvvvvvvvvvv_1",label_key_kkkkkkkkkkkkkkk_2="label_val_vvvvvvvvvvvvvvv_2",label_key_kkkkkkkkkkkkkkk_3="label_val_vvvvvvvvvvvvvvv_3",label_key_kkkkkkkkkkkkkkk_4="label_val_vvvvvvvvvvvvvvv_4",label_key_kkkkkkkkkkkkkkk_5="label_val_vvvvvvvvvvvvvvv_5",label_key_kkkkkkkkkkkkkkk_6="label_val_vvvvvvvvvvvvvvv_6",label_key_kkkkkkkkkkkkkkk_7="label_val_vvvvvvvvvvvvvvv_7",label_key_kkkkkkkkkkkkkkk_8="label_val_vvvvvvvvvvvvvvv_8",label_key_kkkkkkkkkkkkkkk_9="label_val_vvvvvvvvvvvvvvv_9",series_id="0"} 79avalanche_metric_mmmmmmmmmmmmmmm_0_0{cycle_id="0",label_key_kkkkkkkkkkkkkkk_0="label_val_vvvvvvvvvvvvvvv_0",label_key_kkkkkkkkkkkkkkk_1="label_val_vvvvvvvvvvvvvvv_1",label_key_kkkkkkkkkkkkkkk_2="label_val_vvvvvvvvvvvvvvv_2",label_key_kkkkkkkkkkkkkkk_3="label_val_vvvvvvvvvvvvvvv_3",label_key_kkkkkkkkkkkkkkk_4="label_val_vvvvvvvvvvvvvvv_4",label_key_kkkkkkkkkkkkkkk_5="label_val_vvvvvvvvvvvvvvv_5",label_key_kkkkkkkkkkkkkkk_6="label_val_vvvvvvvvvvvvvvv_6",label_key_kkkkkkkkkkkkkkk_7="label_val_vvvvvvvvvvvvvvv_7",label_key_kkkkkkkkkkkkkkk_8="label_val_vvvvvvvvvvvvvvv_8",label_key_kkkkkkkkkkkkkkk_9="label_val_vvvvvvvvvvvvvvv_9",series_id="1"} 93
global:scrape_interval: 15sremote_write:- url: https://cortex.default.costblog.opstrace.io/api/v1/pushbearer_token_file: /home/ec2-user/work/tenant-api-token-defaultscrape_configs:- job_name: loadteststatic_configs:- targets: [ "localhost:9001", "localhost:9002", "localhost:9003", "localhost:9004", "localhost:9005" ]
tenants:- defaultnode_count: 3cert_issuer: letsencrypt-prod
Under the hood this leverages three t3a.xlarge EC2 instances, which along with
S3 storage and API requests account for 75% of the cost. Opstrace does use
various other networking and storage resources, all of which are included in the
final overall cost.
[5] Cortex compactionreduces the long-term storage needs.
[6] With capacity for 1M active time series you can ingest the system metrics of almost 1,500 hosts using node_exporter that provides 700 metrics per machine; or you can reduce the host count to 100 and ingest system metrics plus 100 containers with nearly 100 active series each.