


Jul 1 | 8 min read
A Giant Leap for Alert Management
A look at Cortex & Loki alerts integrated into Opstrace
If you're reading this, you probably understand the importance of alerts. You may also be aware of just how difficult it is to set up and maintain a reliable alerting system. After all, you rely on your alerting system to tell you when all other things are not working—you cannot tolerate failure here. Recently, Grafana 8 has changed the game by adding support for data sources, and as of our latest release (v2020-06-25), Opstrace now supports Grafana 8.
Grafana has always supported an alerting feature (now called Legacy Alerts), however, many people prefer to define alerts to be evaluated by their storage backend, e.g., Prometheus. In this scenario, creating and maintaining quality alerts is toilsome: dashboards are defined in Grafana, alerting rules defined in Prometheus itself and the alert configuration (receivers, etc.) is defined in Alertmanager. Keeping these updated and in sync is important and can be easily overlooked (for example, remembering to update a dashboard threshold when changing an alert condition). Additionally, defining these in the first place can be challenging, with no uniform interface to guide you or provide real-time validation. Finally, without special consideration to configuring and architecting the Ruler and Alertmanager deployments, the alerting pipeline is often a brittle single-point-of-failure.
With Opstrace, you can now use the Grafana 8 UI to directly manage alerts in Cortex and Loki. Opstrace also ships with a multi-tenant Alertmanager that is highly available, and a highly available Ruler for Cortex and another for Loki. The new Grafana web UI makes creating and managing everything to do with alerts far simpler than it had been. (It even supplants our recently-released Alertmanager editor.) Opstrace ships with default alerts for the Opstrace system itself, so all you have to do is set up a receiver and alerting policy to get alerts on the Opstrace instance. You can also easily copy and paste other community content and have it work.

In this post, we'll show you some of what you can do with Opstrace and Grafana 8.
Walkthrough
We like to provide a clear, step-by-step walkthrough that you can not only read but reproduce on your own. Here we'll walk you through two examples: alerts based on metrics and one based on logs.
Example 1: A "Dead Man's Switch"
Problems can happen anywhere in your stack, including with your Alertmanager. But if a problem does happen, how would you know? A dead man's switch is a physical concept we can translate to the software world: it's meant to alert you if someone—or in this case, something—has become unavailable. It necessarily relies on some other third party to perform the notification when the unavailability happens. In this example, we create an alert rule that always fires, notifying a third party repeatedly. When the alert stops firing, the third party will then initiate its own alert. We'll use a thrid-party service called "Dead Man's Snitch." We'll follow these steps:
- Define an "alert rule" that will always fire.
- Create a dead man's snitch (our third-party notifier).
- Create a "contact point" for the snitch.
- Set up a specific "notification policy" so our rule will alert only the snitch.
Suggestion: if you've never done this before, try it out for yourself even if you're not yet using Opstrace.
Step 1: Create Alert Rule that Always Fires
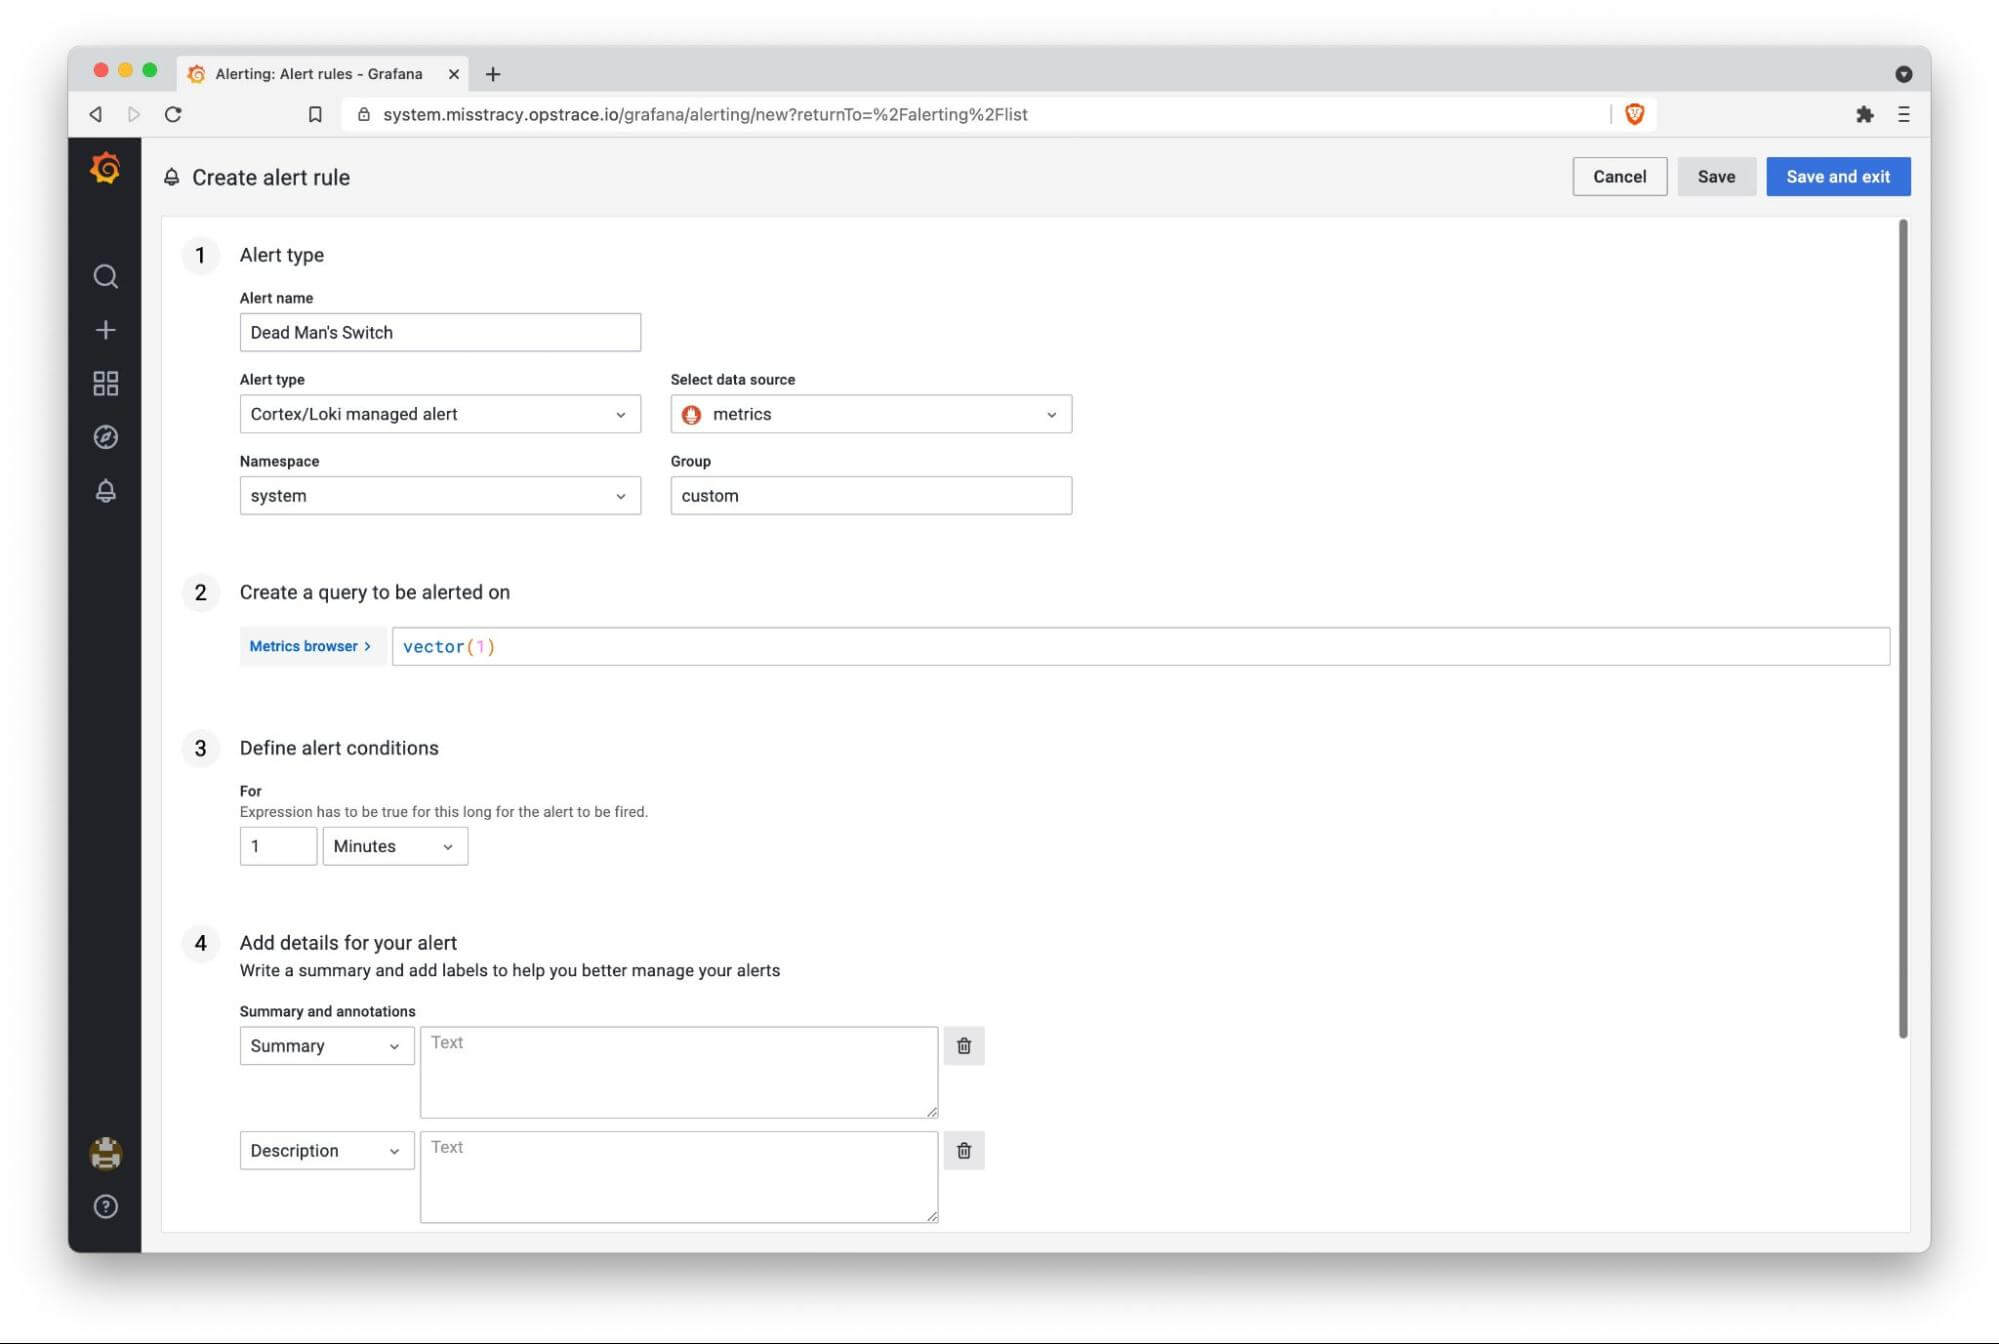
We'll use the new Grafana 8 UI to define an alert with the following query:
vector(1). (Because this will always evaluate to 1, the alert will always
fire—which is exactly what we want!)
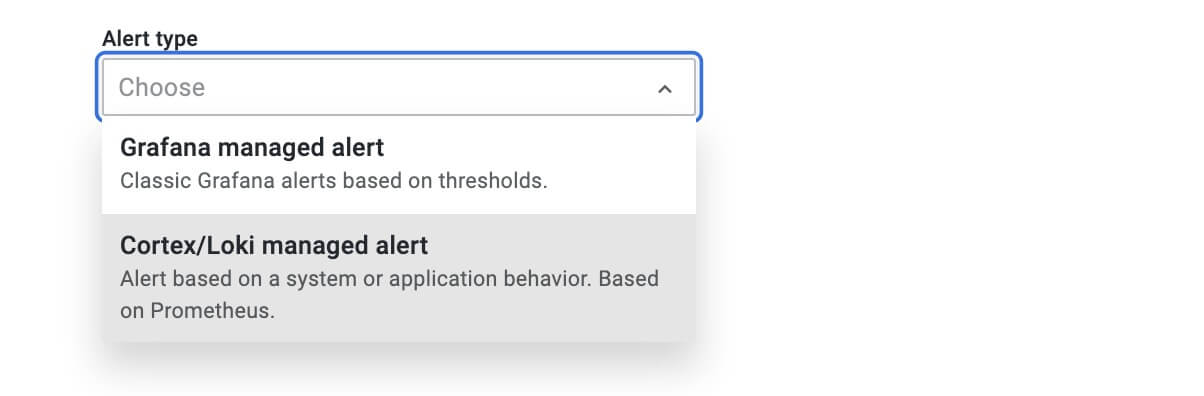
To create the rule we need to provide an alert name, alert type (Grafana or Cortex/Loki), data source, alert group, and namespace (tenant):

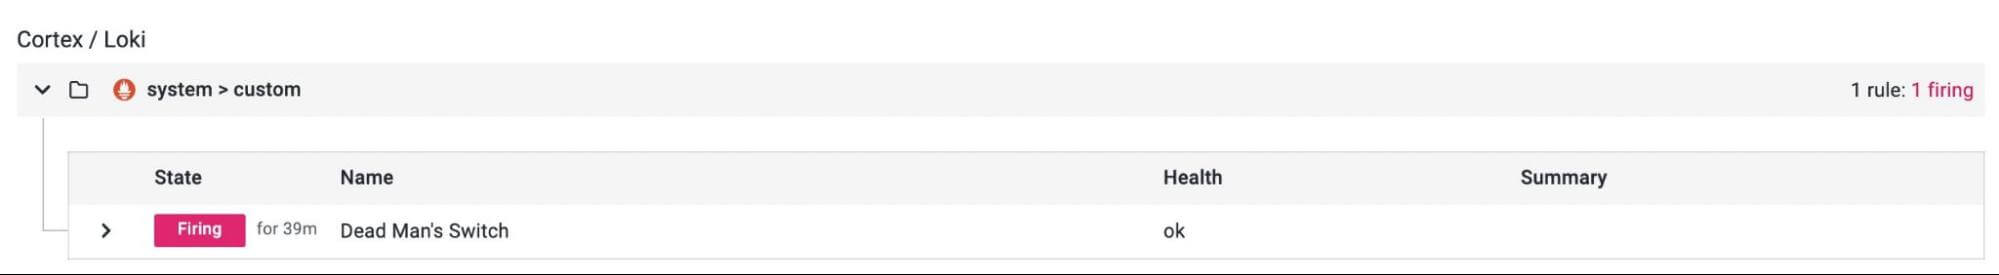
Under the same alert rules tab, you should then see the alert go "pending" and then "firing":

Step 2: Create a Snitch
It's time to set up our "snitch," the third party that will notify us if our primary notification system stops working. Jim Weber has a nice GIF that demonstrates the concept with Prometheus on Kubernetes:
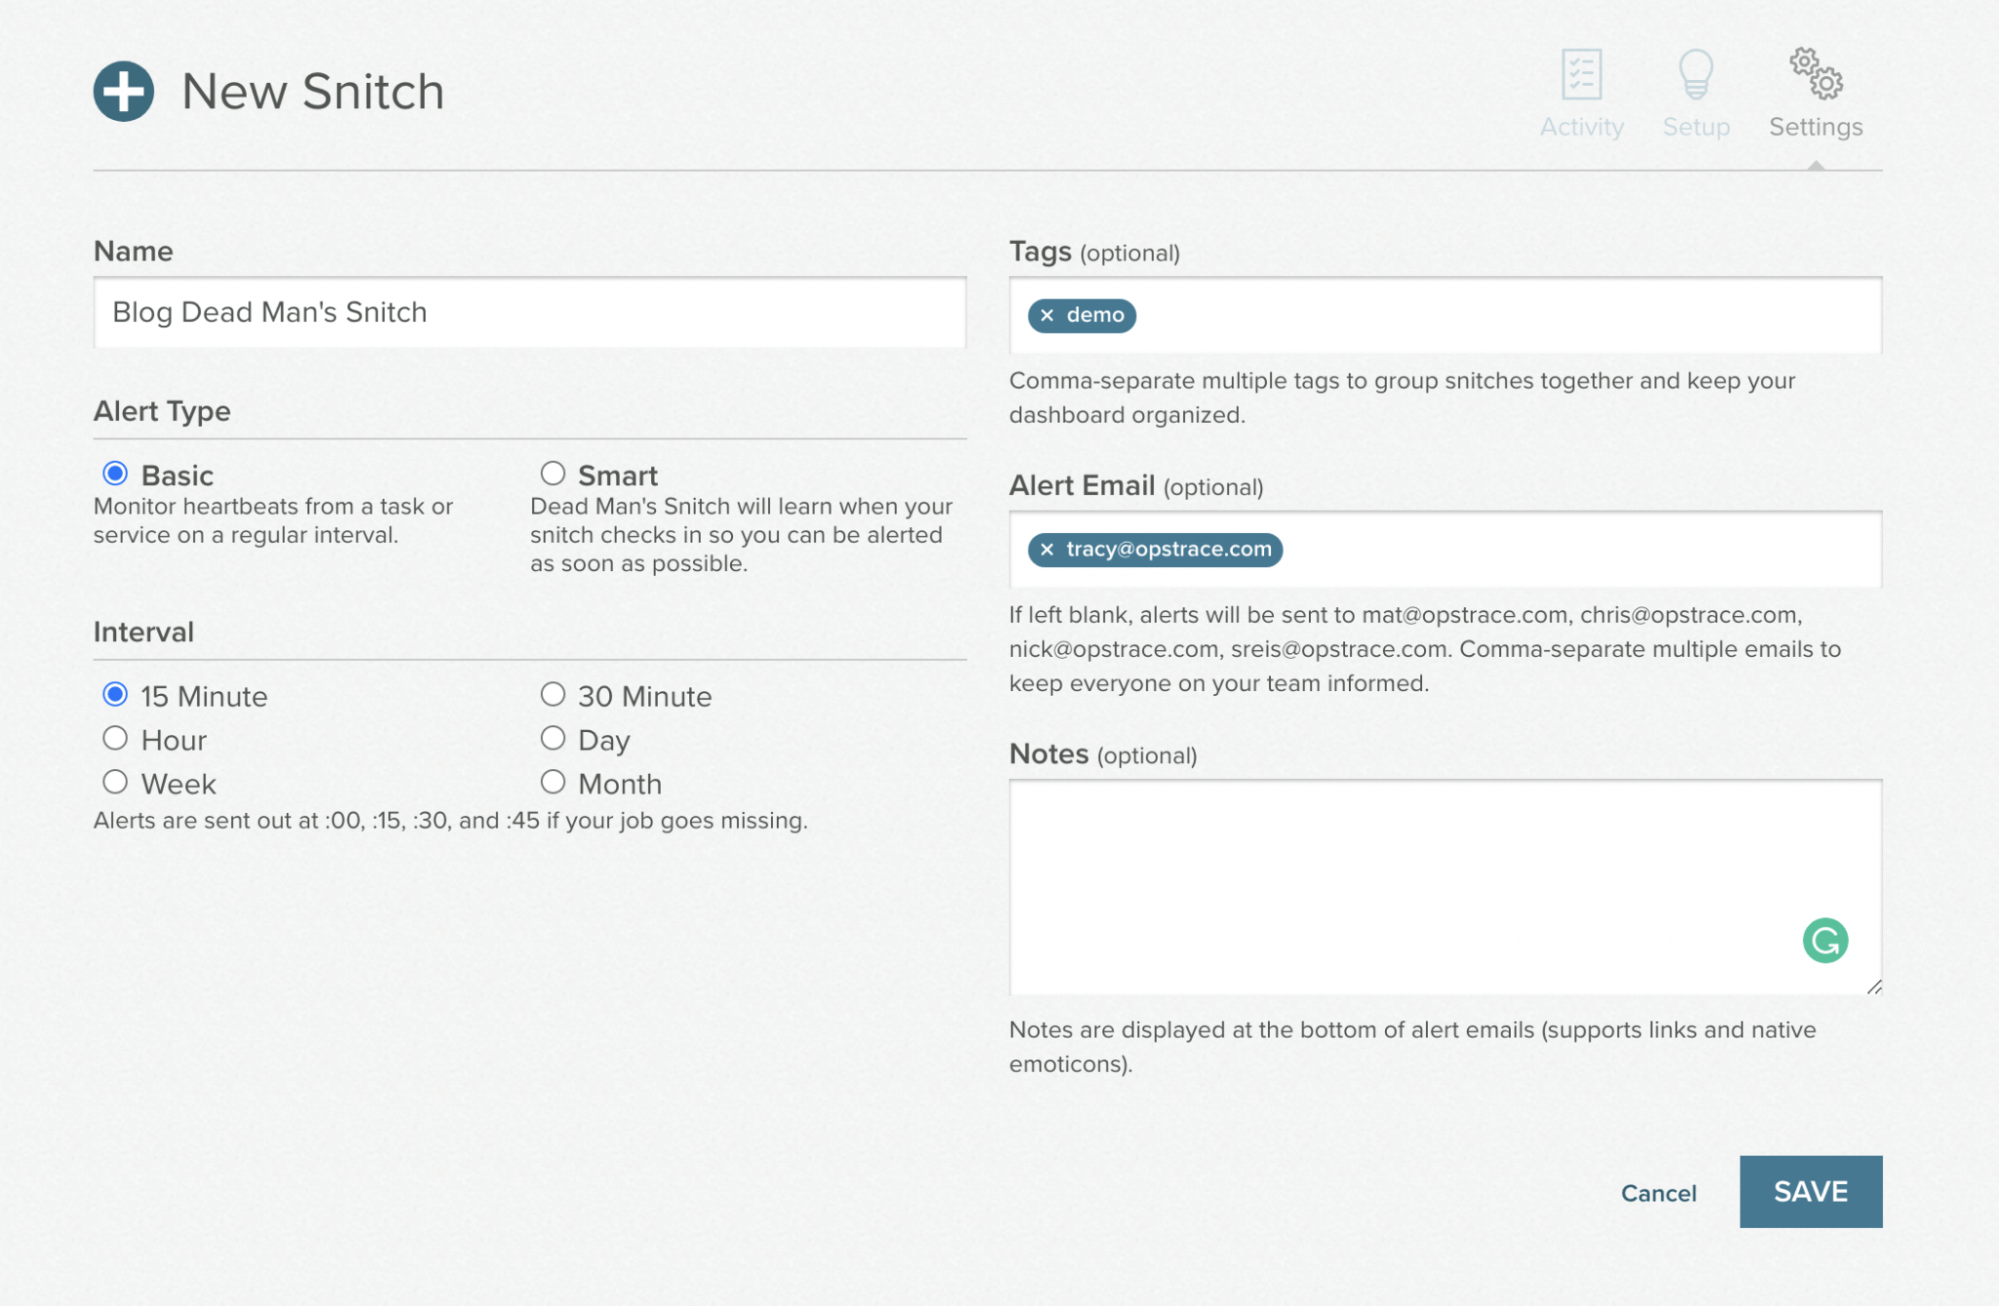
For our "out of band" process, we'll use the third party service deadmanssnitch.com. Start by creating an account (the free plan provides for one snitch, which is all we need). Then create a new snitch with whatever values you want, for example:

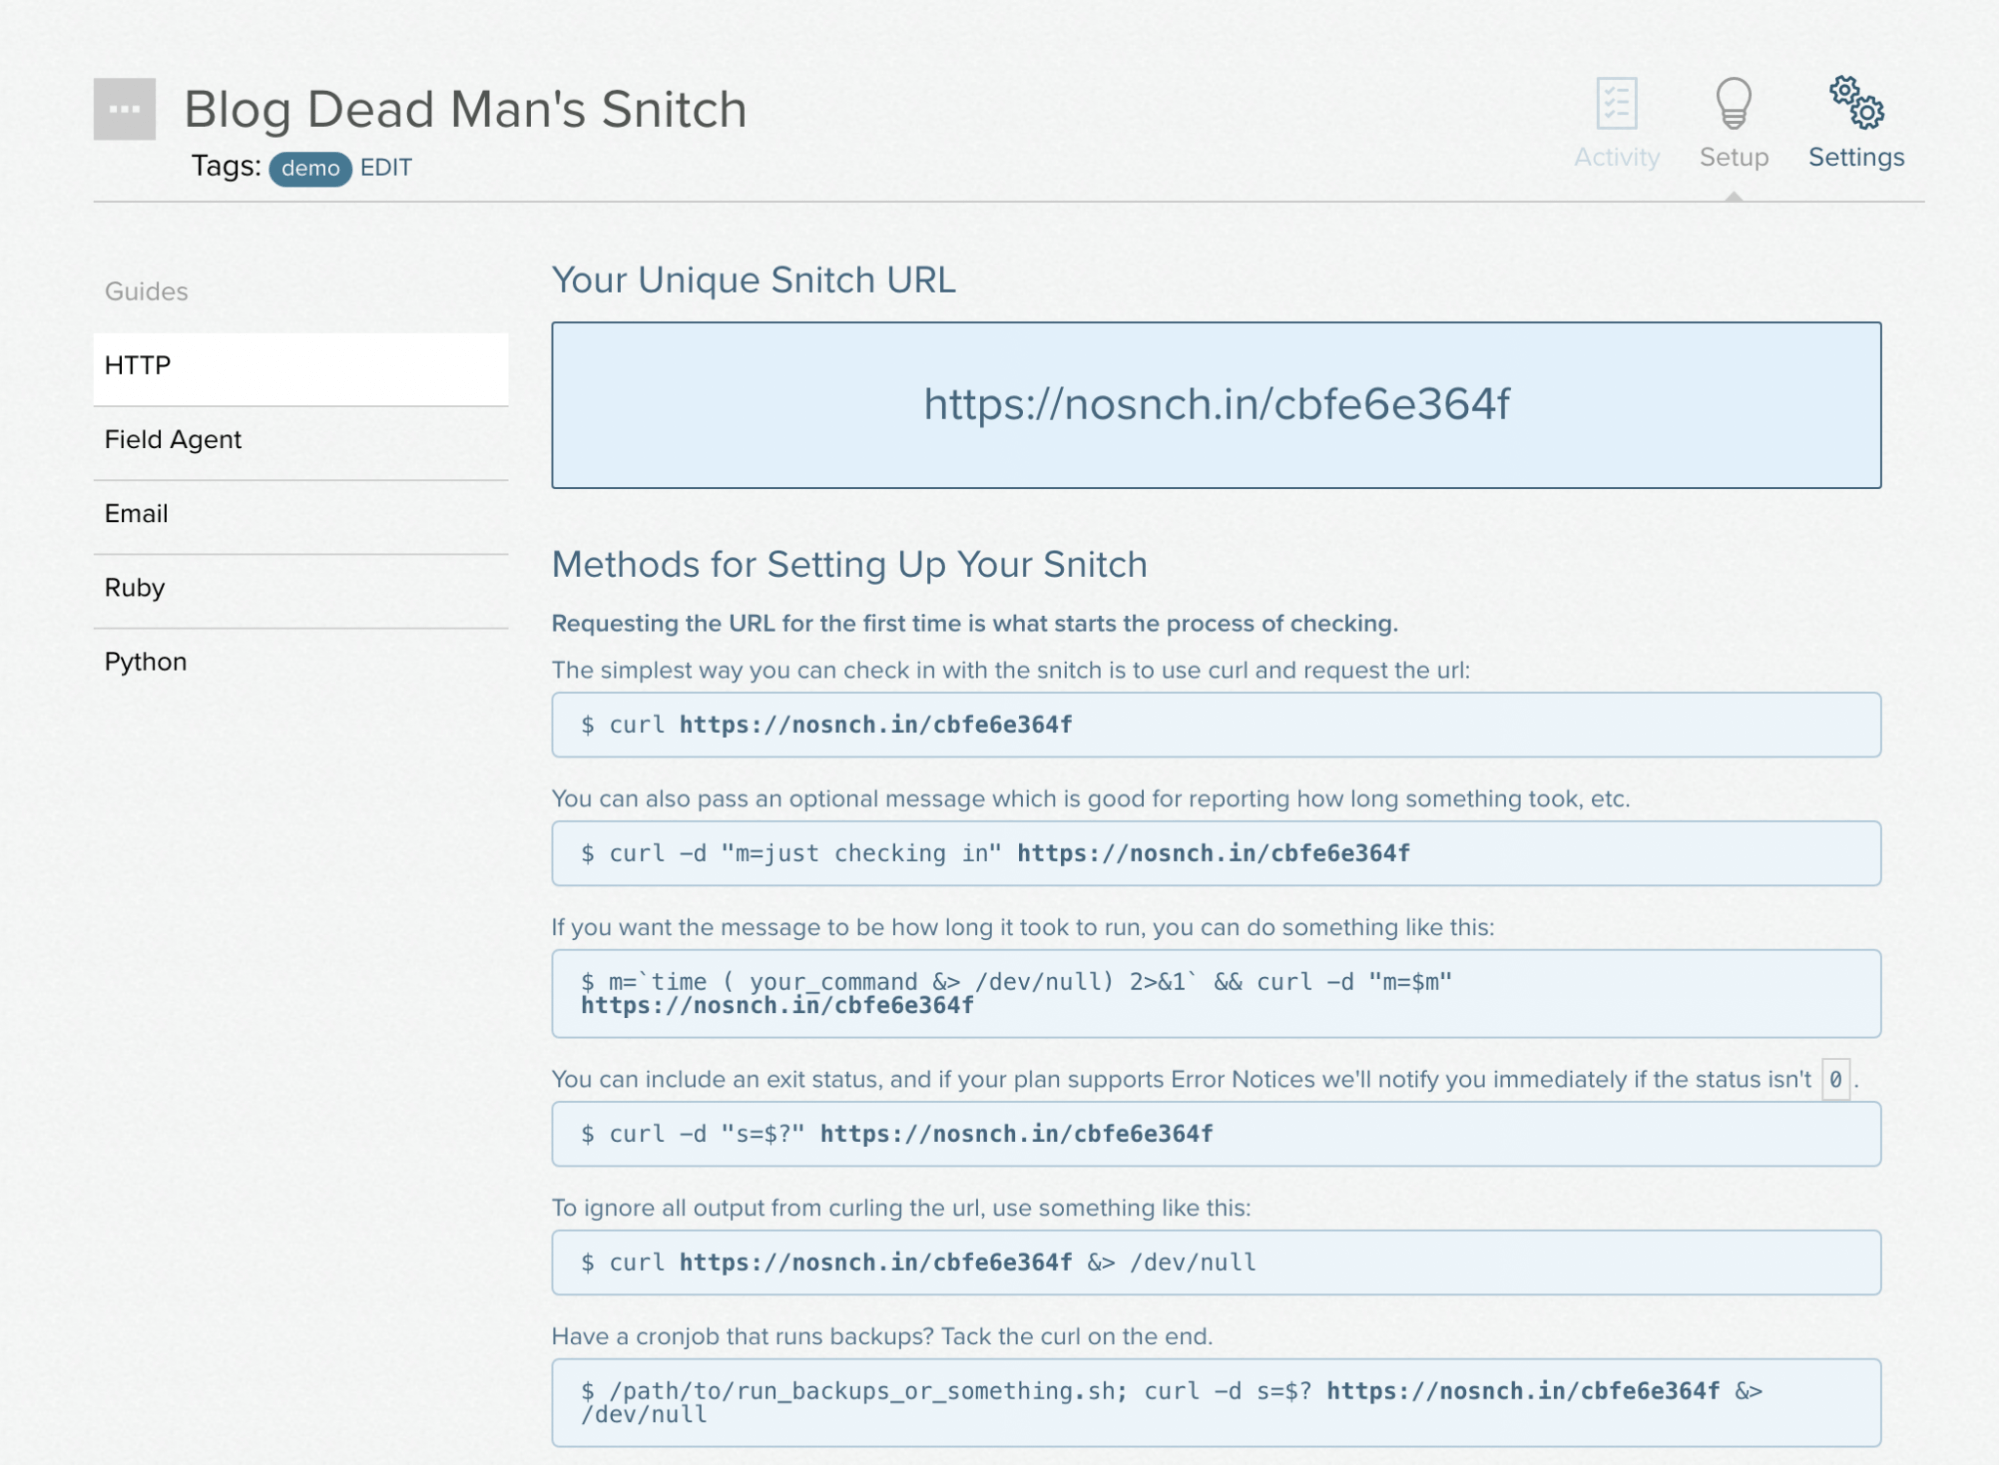
You'll receive a setup page that will provide various methods for calling to the service—we'll take the URL and use that to configure a webhook contact point in Grafana:

Note: by default, Dead Man's Snitch provides only email notification; however, you you can integrate it with PagerDuty, which we leave as an exercise to the reader.
Step 3: Configure a Contact Point
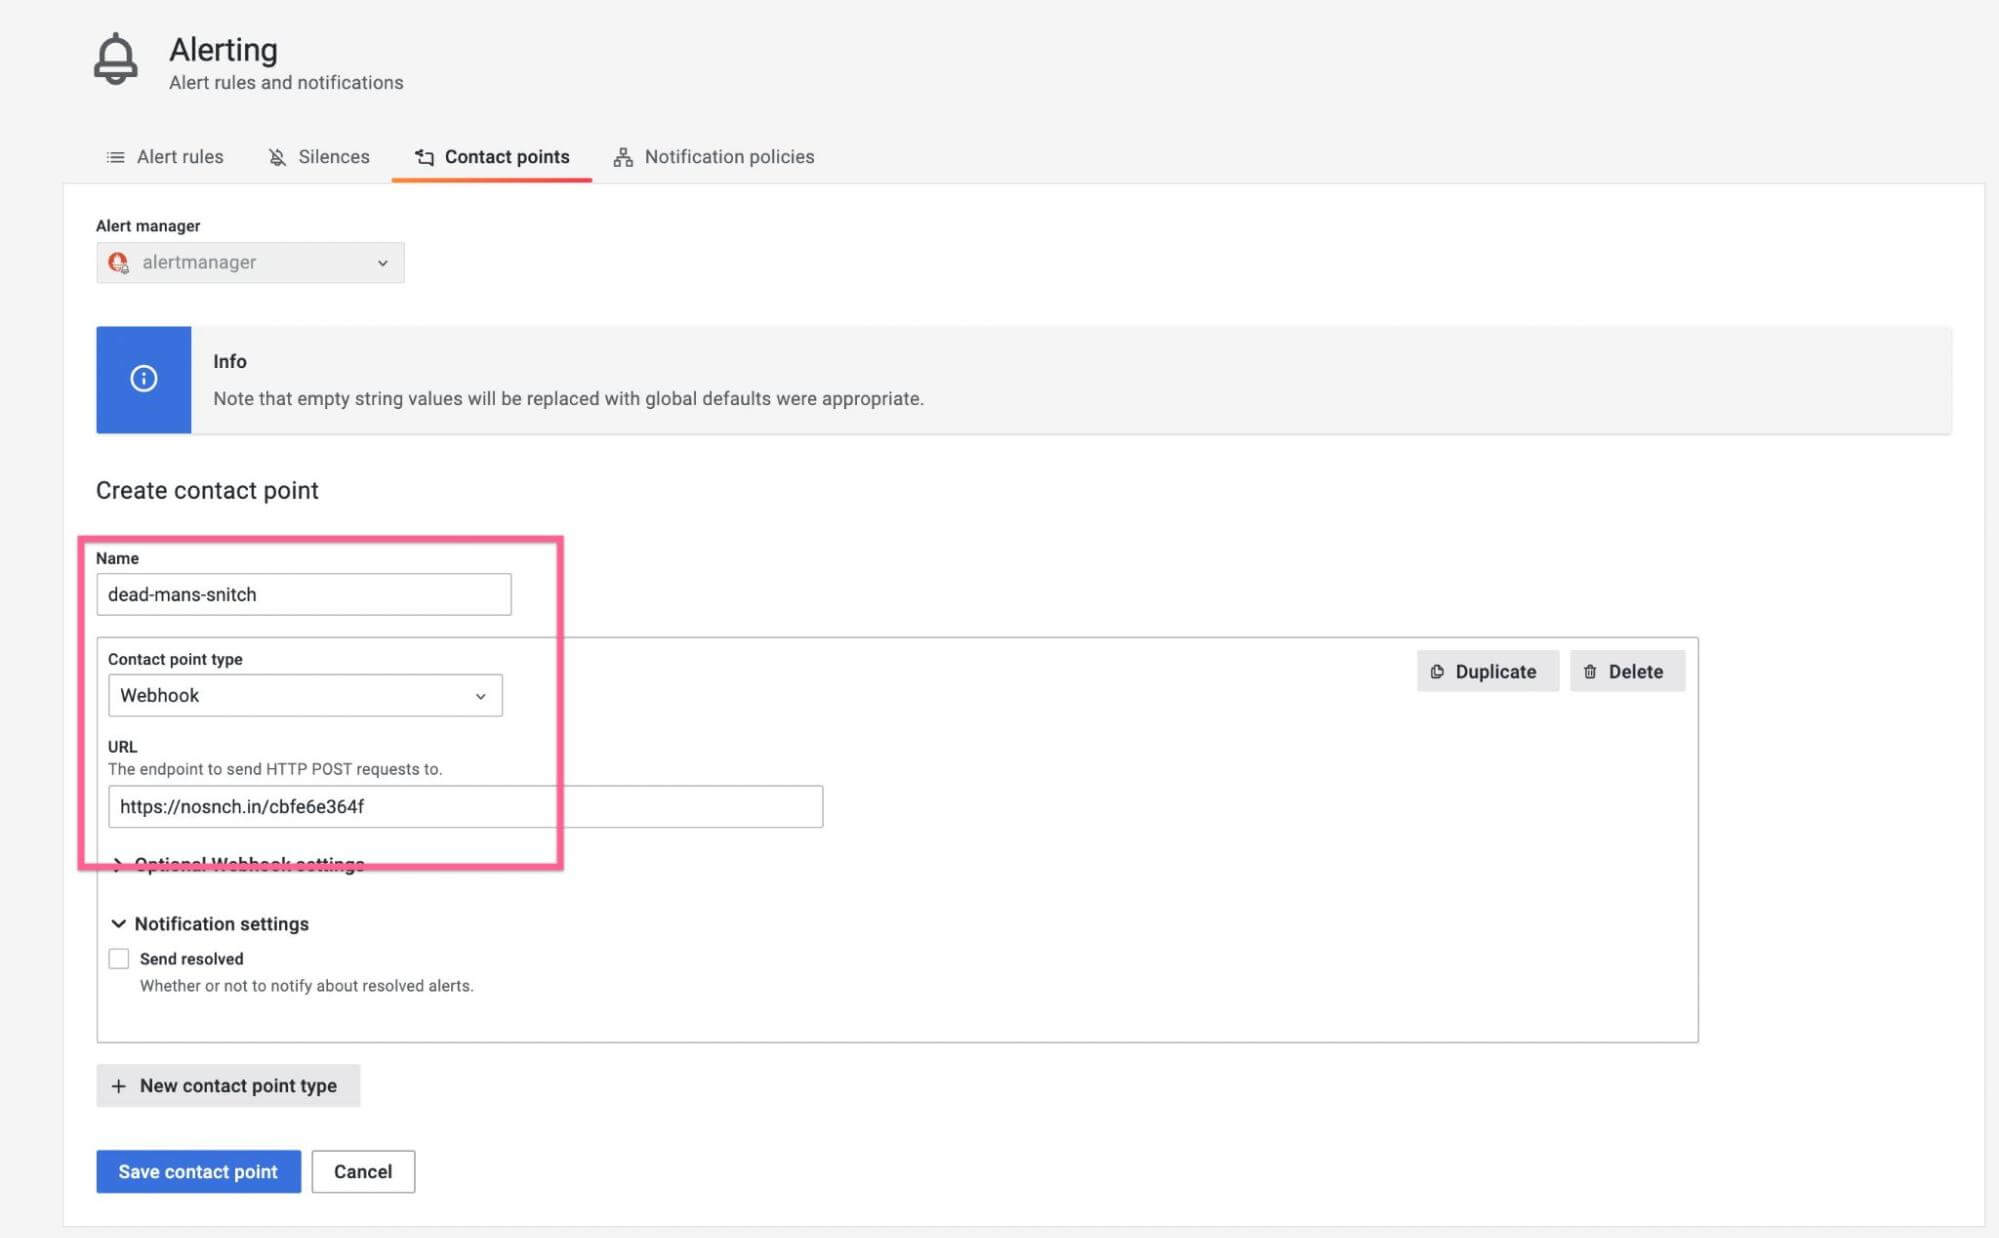
Go to the "contact points" tab. Using the URL of your own snitch, create a new contact point with type "webhook":

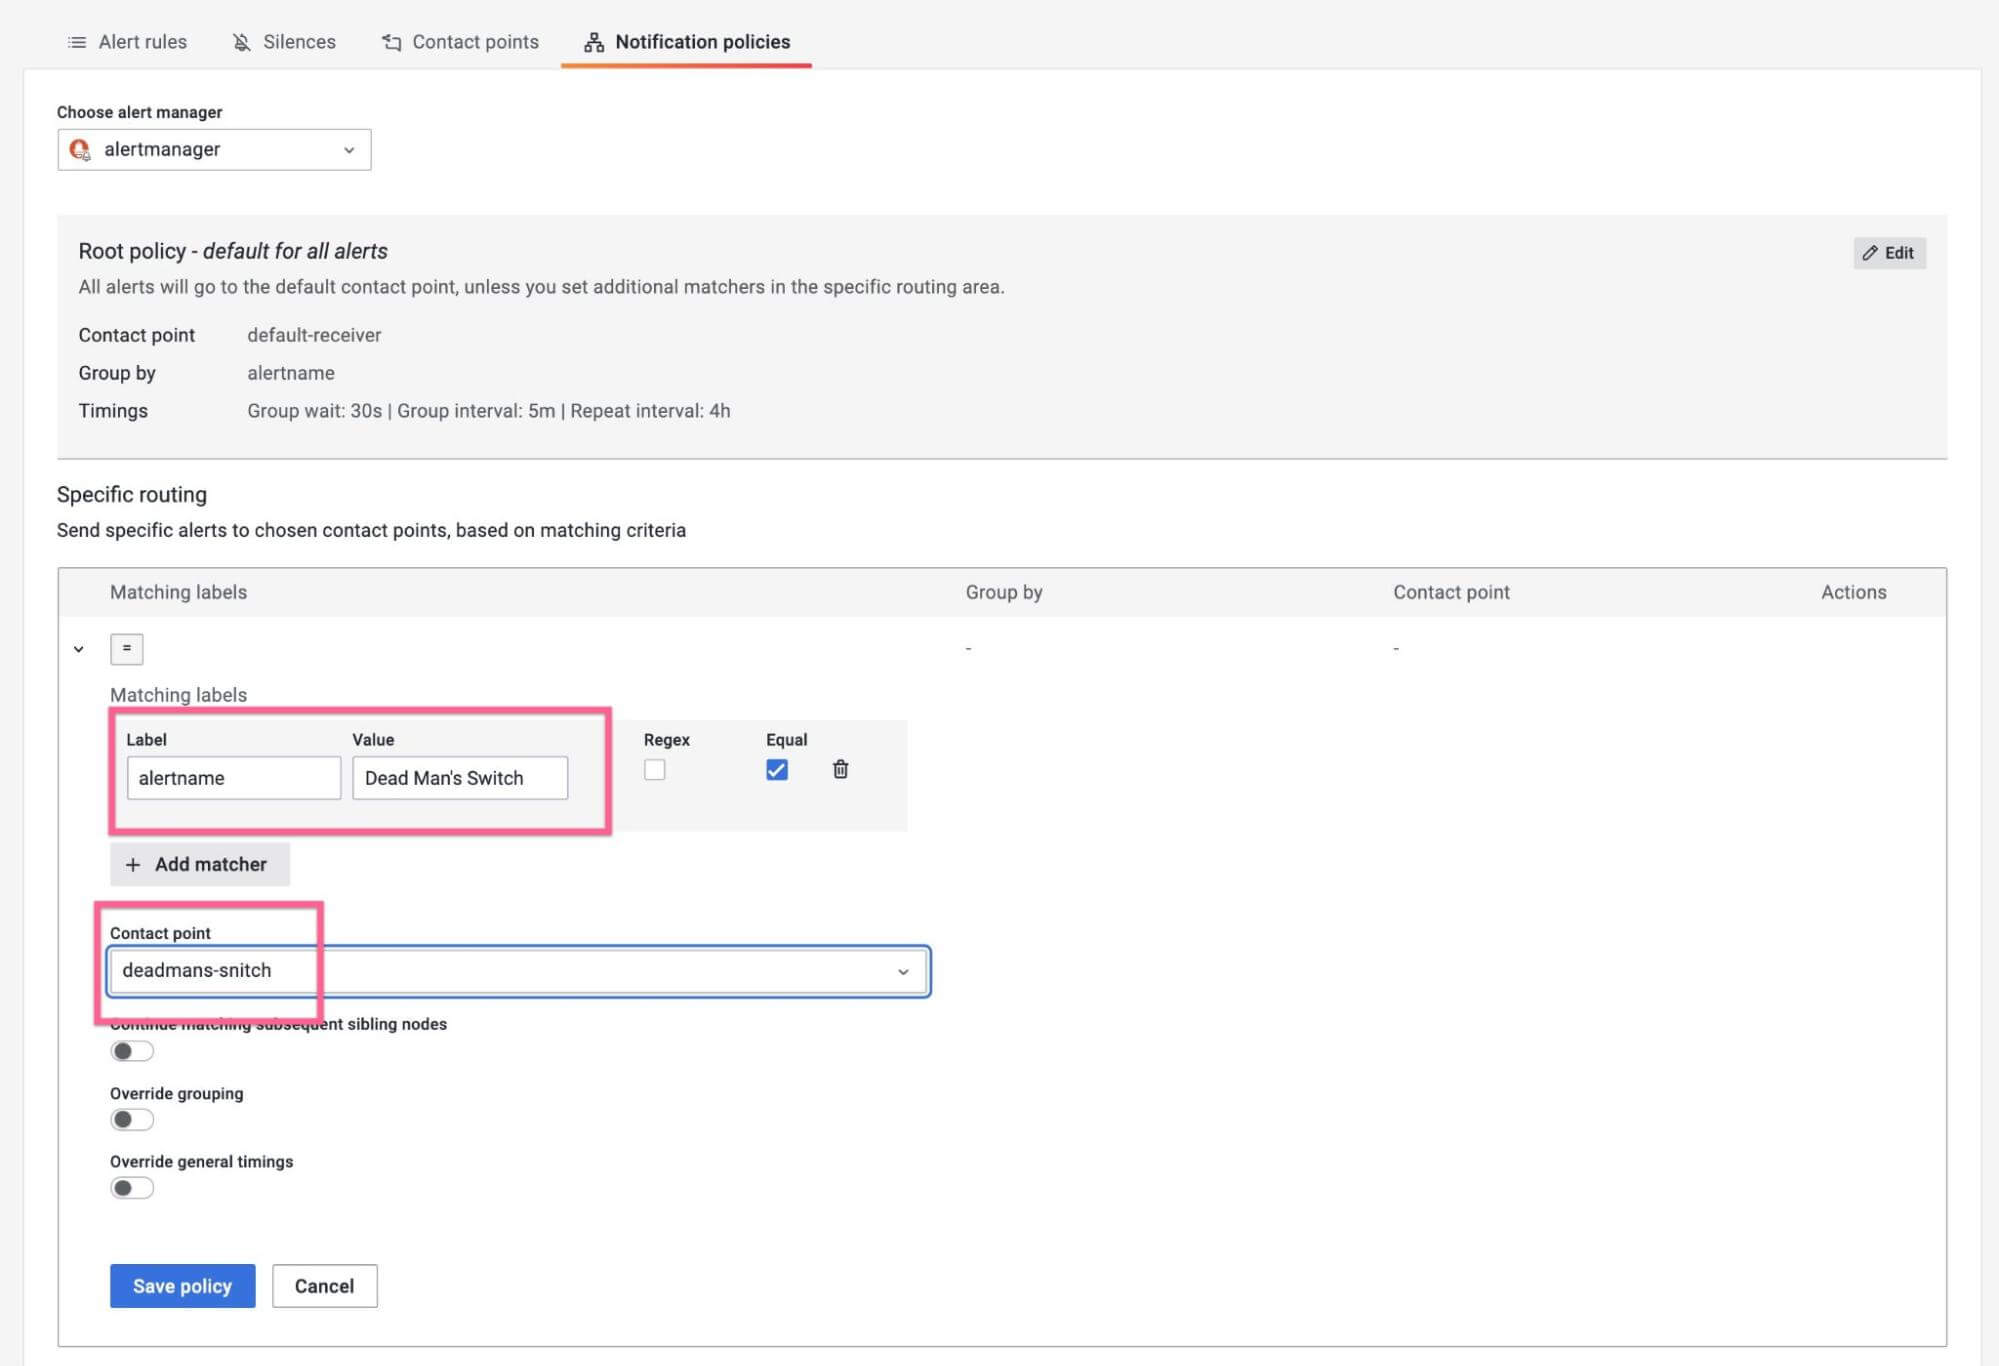
Step 4: Create a Notification Policy
The final step is to connect the alert rule to the contact point via a specific
notification policy. Under the "notification policies" tab, click "create
specific policy." We can match using the automatically provided alertname
label (since only this rule should call out to the snitch):

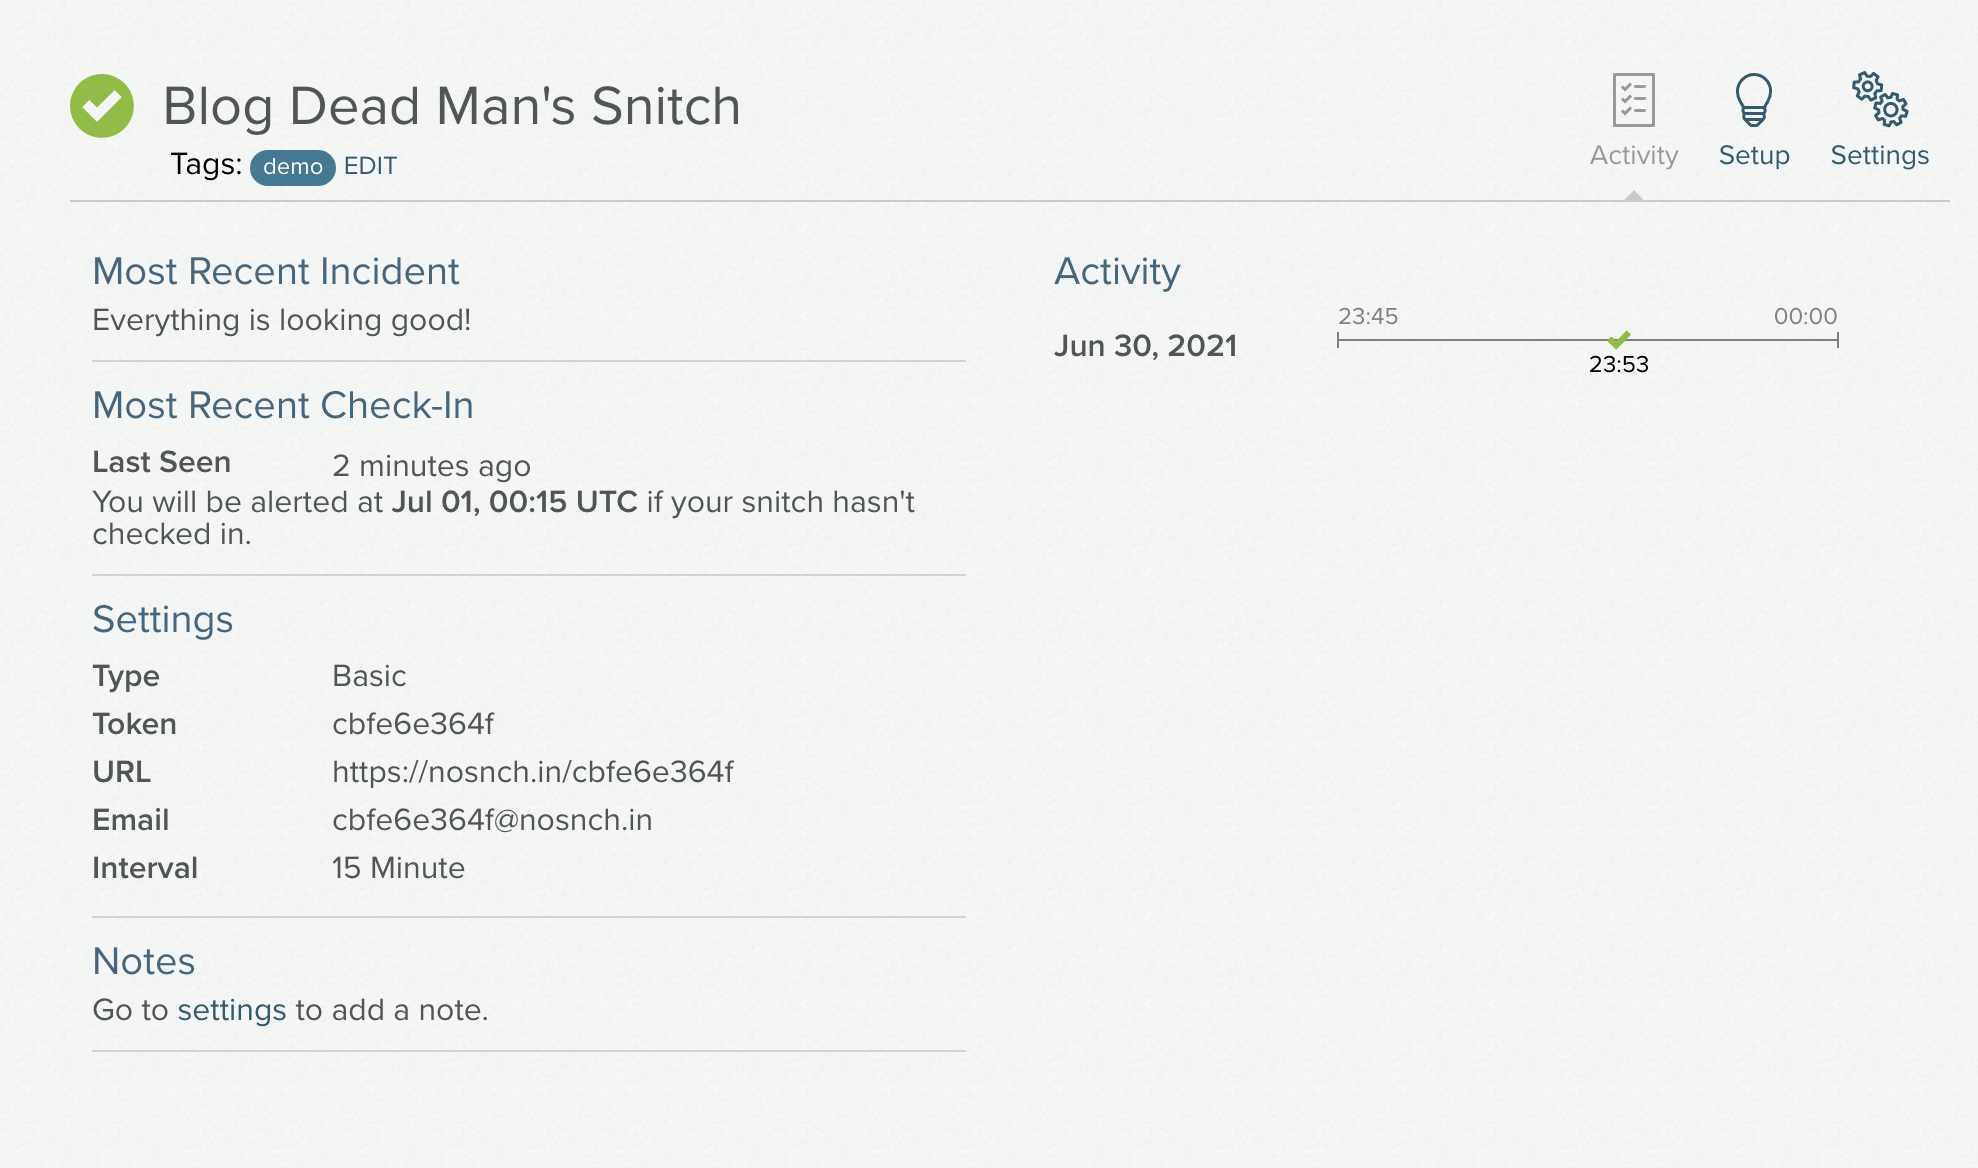
All of the pieces are now wired together. Once the rule fires and the Dead Man's Snitch webhook is called, you'll see this activity reflected in their UI:

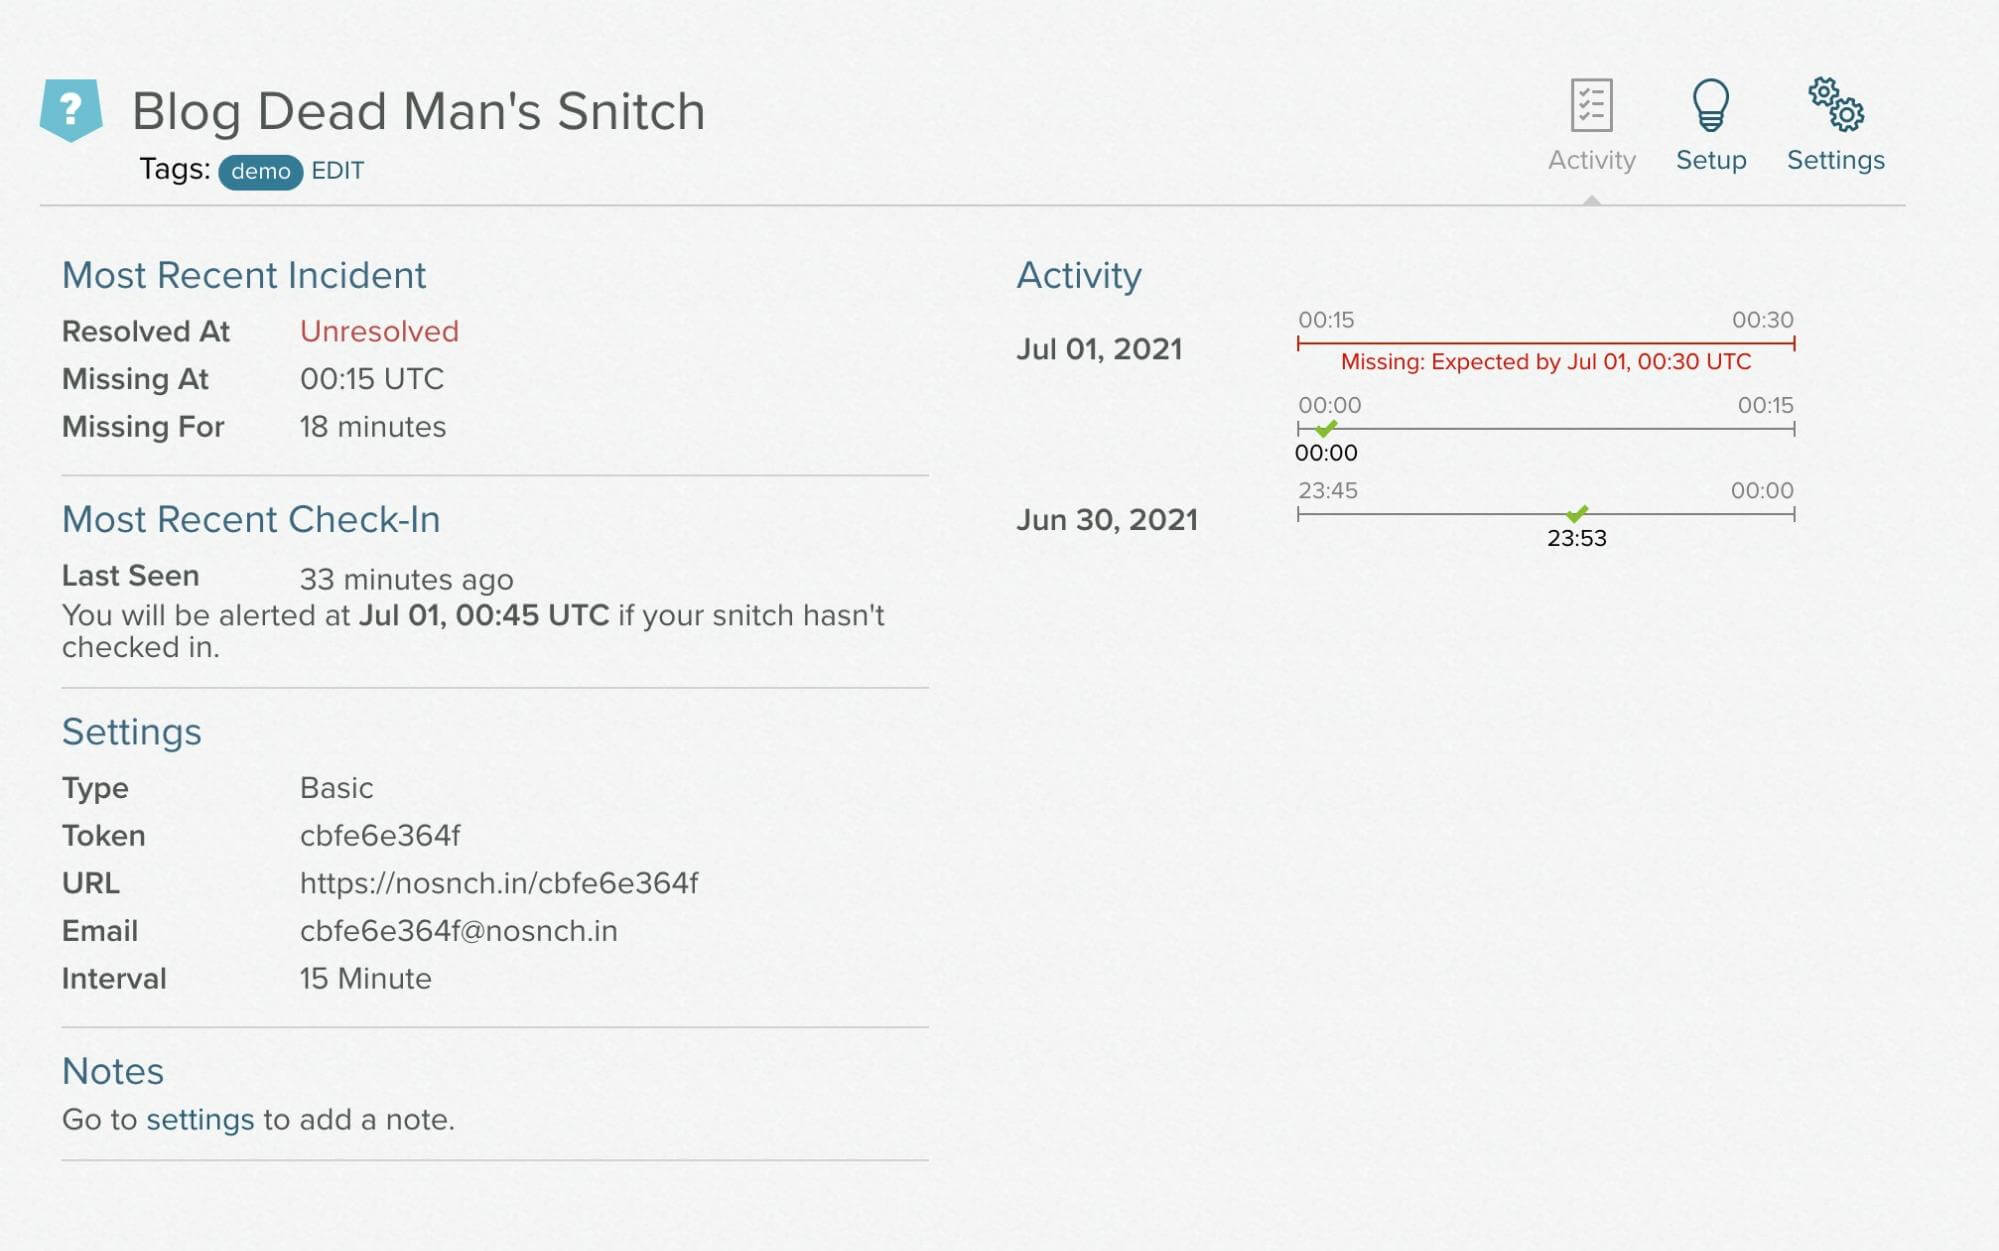
If you silence the alert, you'll see the following:

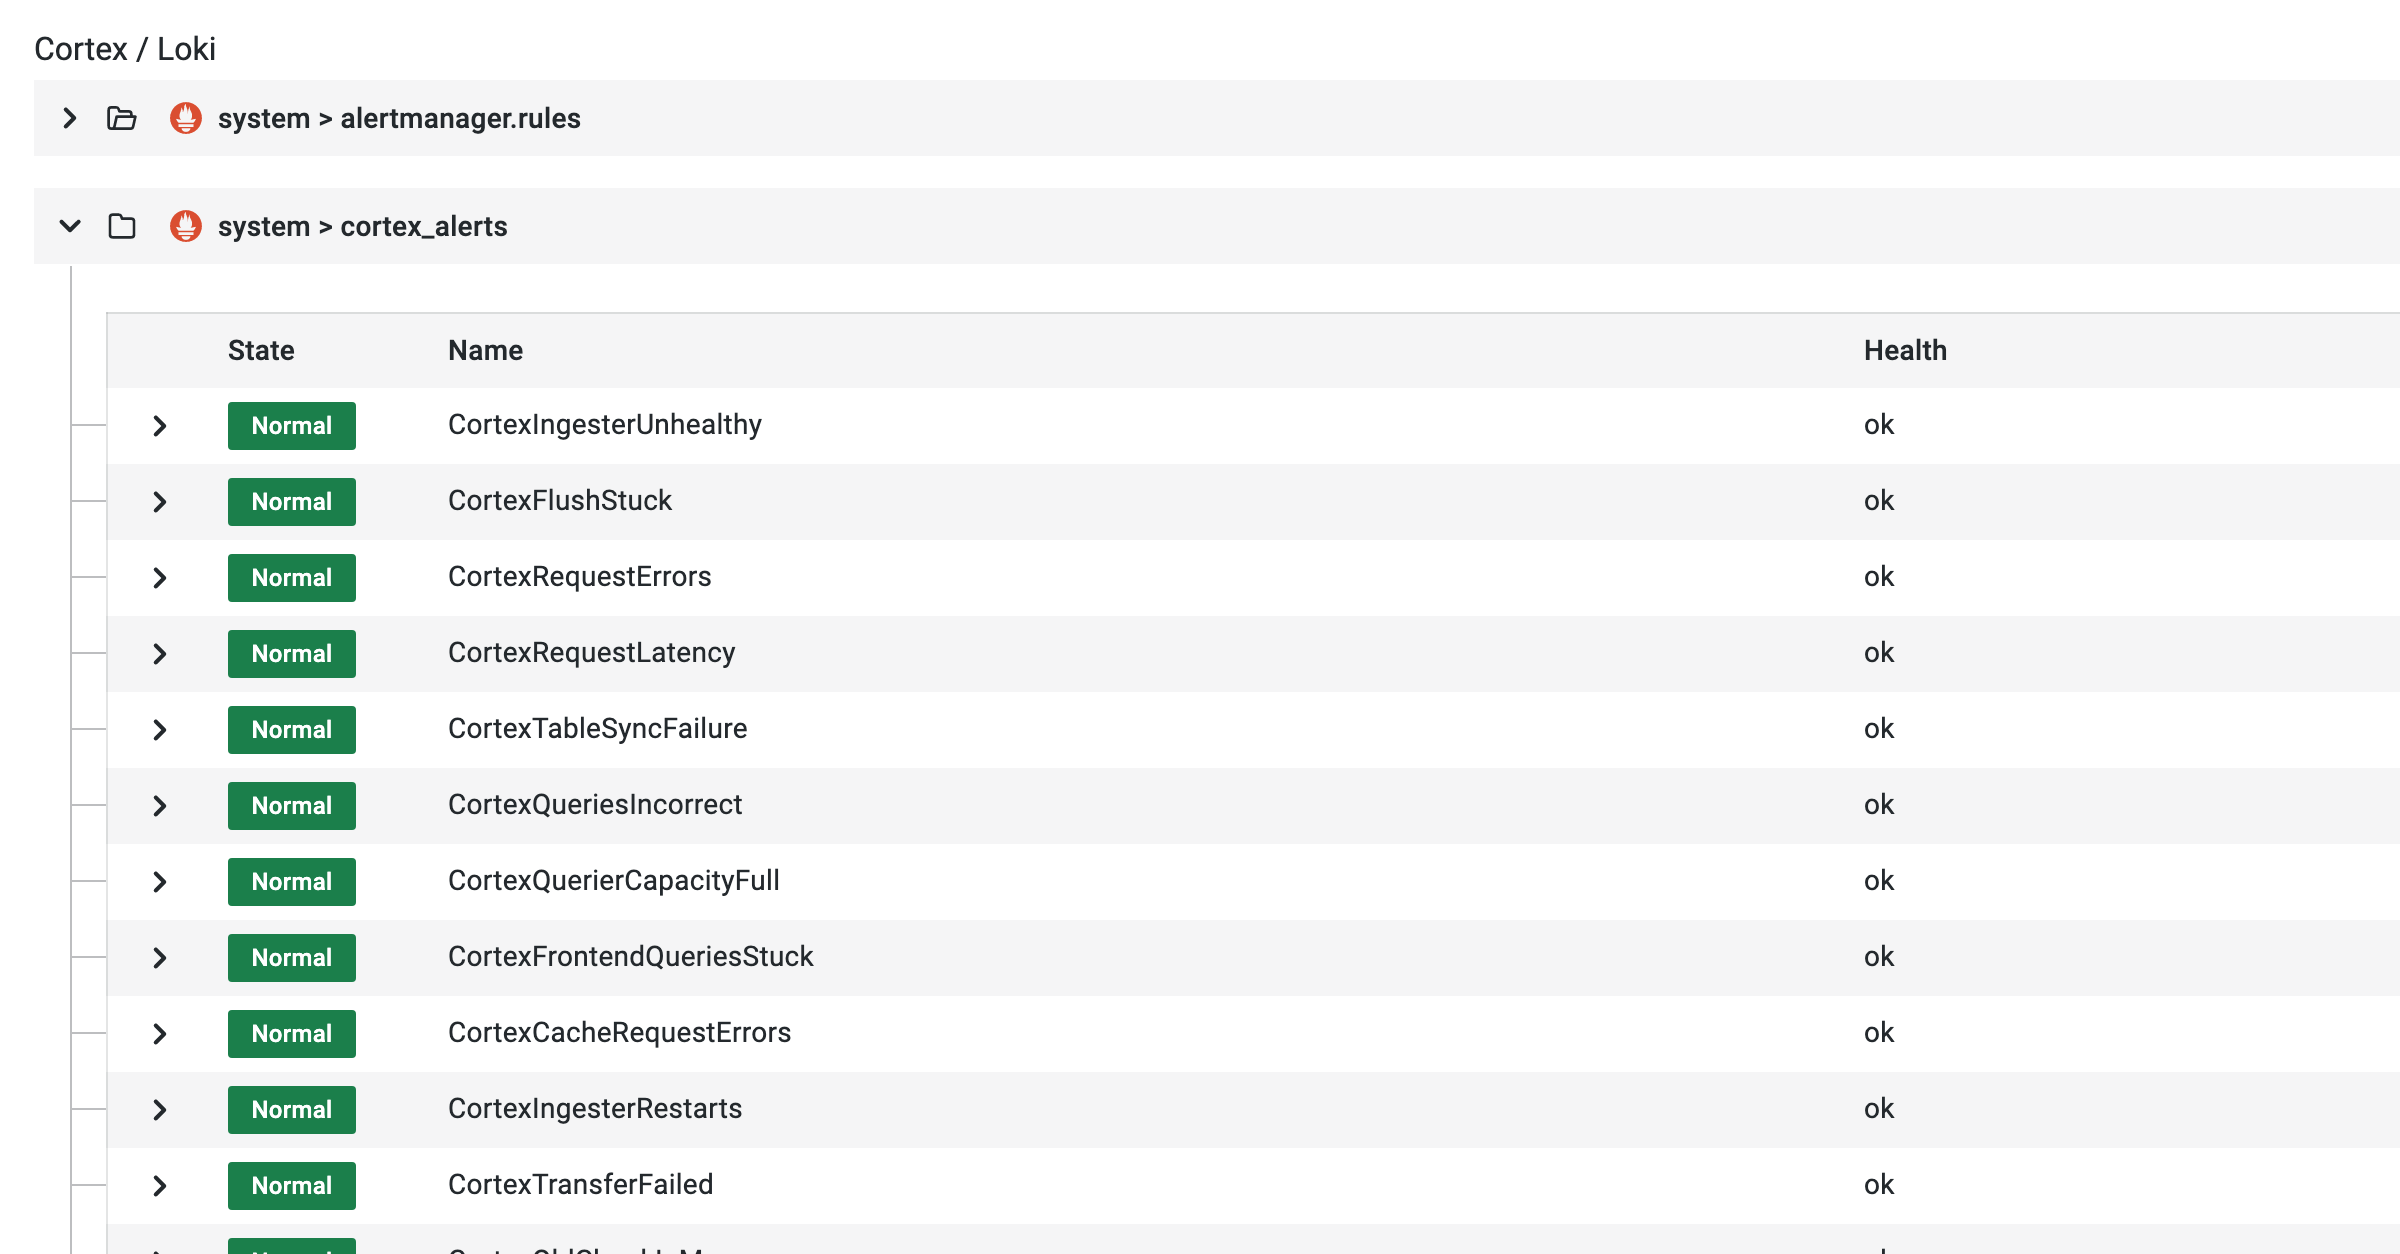
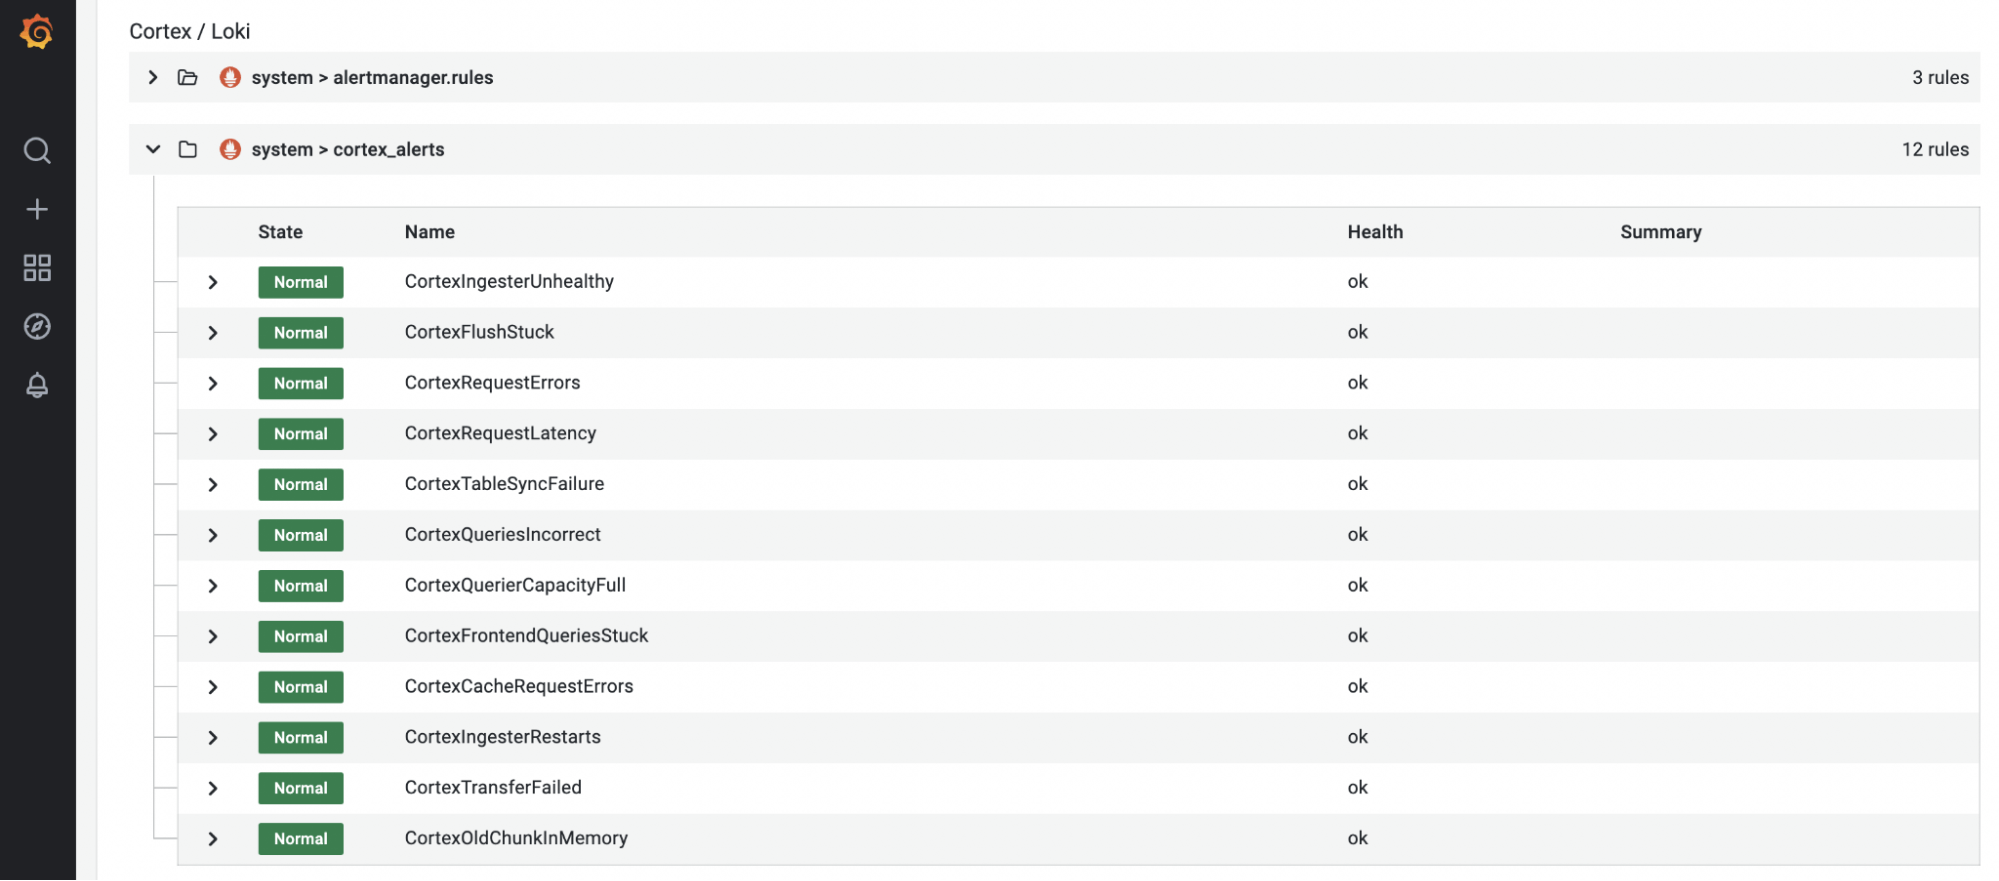
This example demonstrated configuring a system alert for your Opstrace instance. In addition, Opstrace ships with hundreds of default alerts for the various internal components that Opstrace consists of. All you need to do to receive alerts for these is to set up your own receiver and notification policy. For example, Cortex alerts installed by default:

Using Slack Incoming Webhooks is an easy way to get started.
Example 2: Alerting on Log Volume
Perhaps more interesting than the user interface changes to configure your metrics-based alerts is the ability to now do that with logs. Opstrace ships with Loki for log collection and querying (and by default ingests system logs for easy troubleshooting). In this example, we will generate some dummy log lines and then walk through alerting on a change in the log ingest rate—the rate of log lines coming into our tenant. We'll follow these steps:
- Inspect some nominal dummy workload.
- Define an alert rule (using the
logsdata source). - Increase the dummy workload.
- Observe the alert firing.
Step 1: Dummy Workload
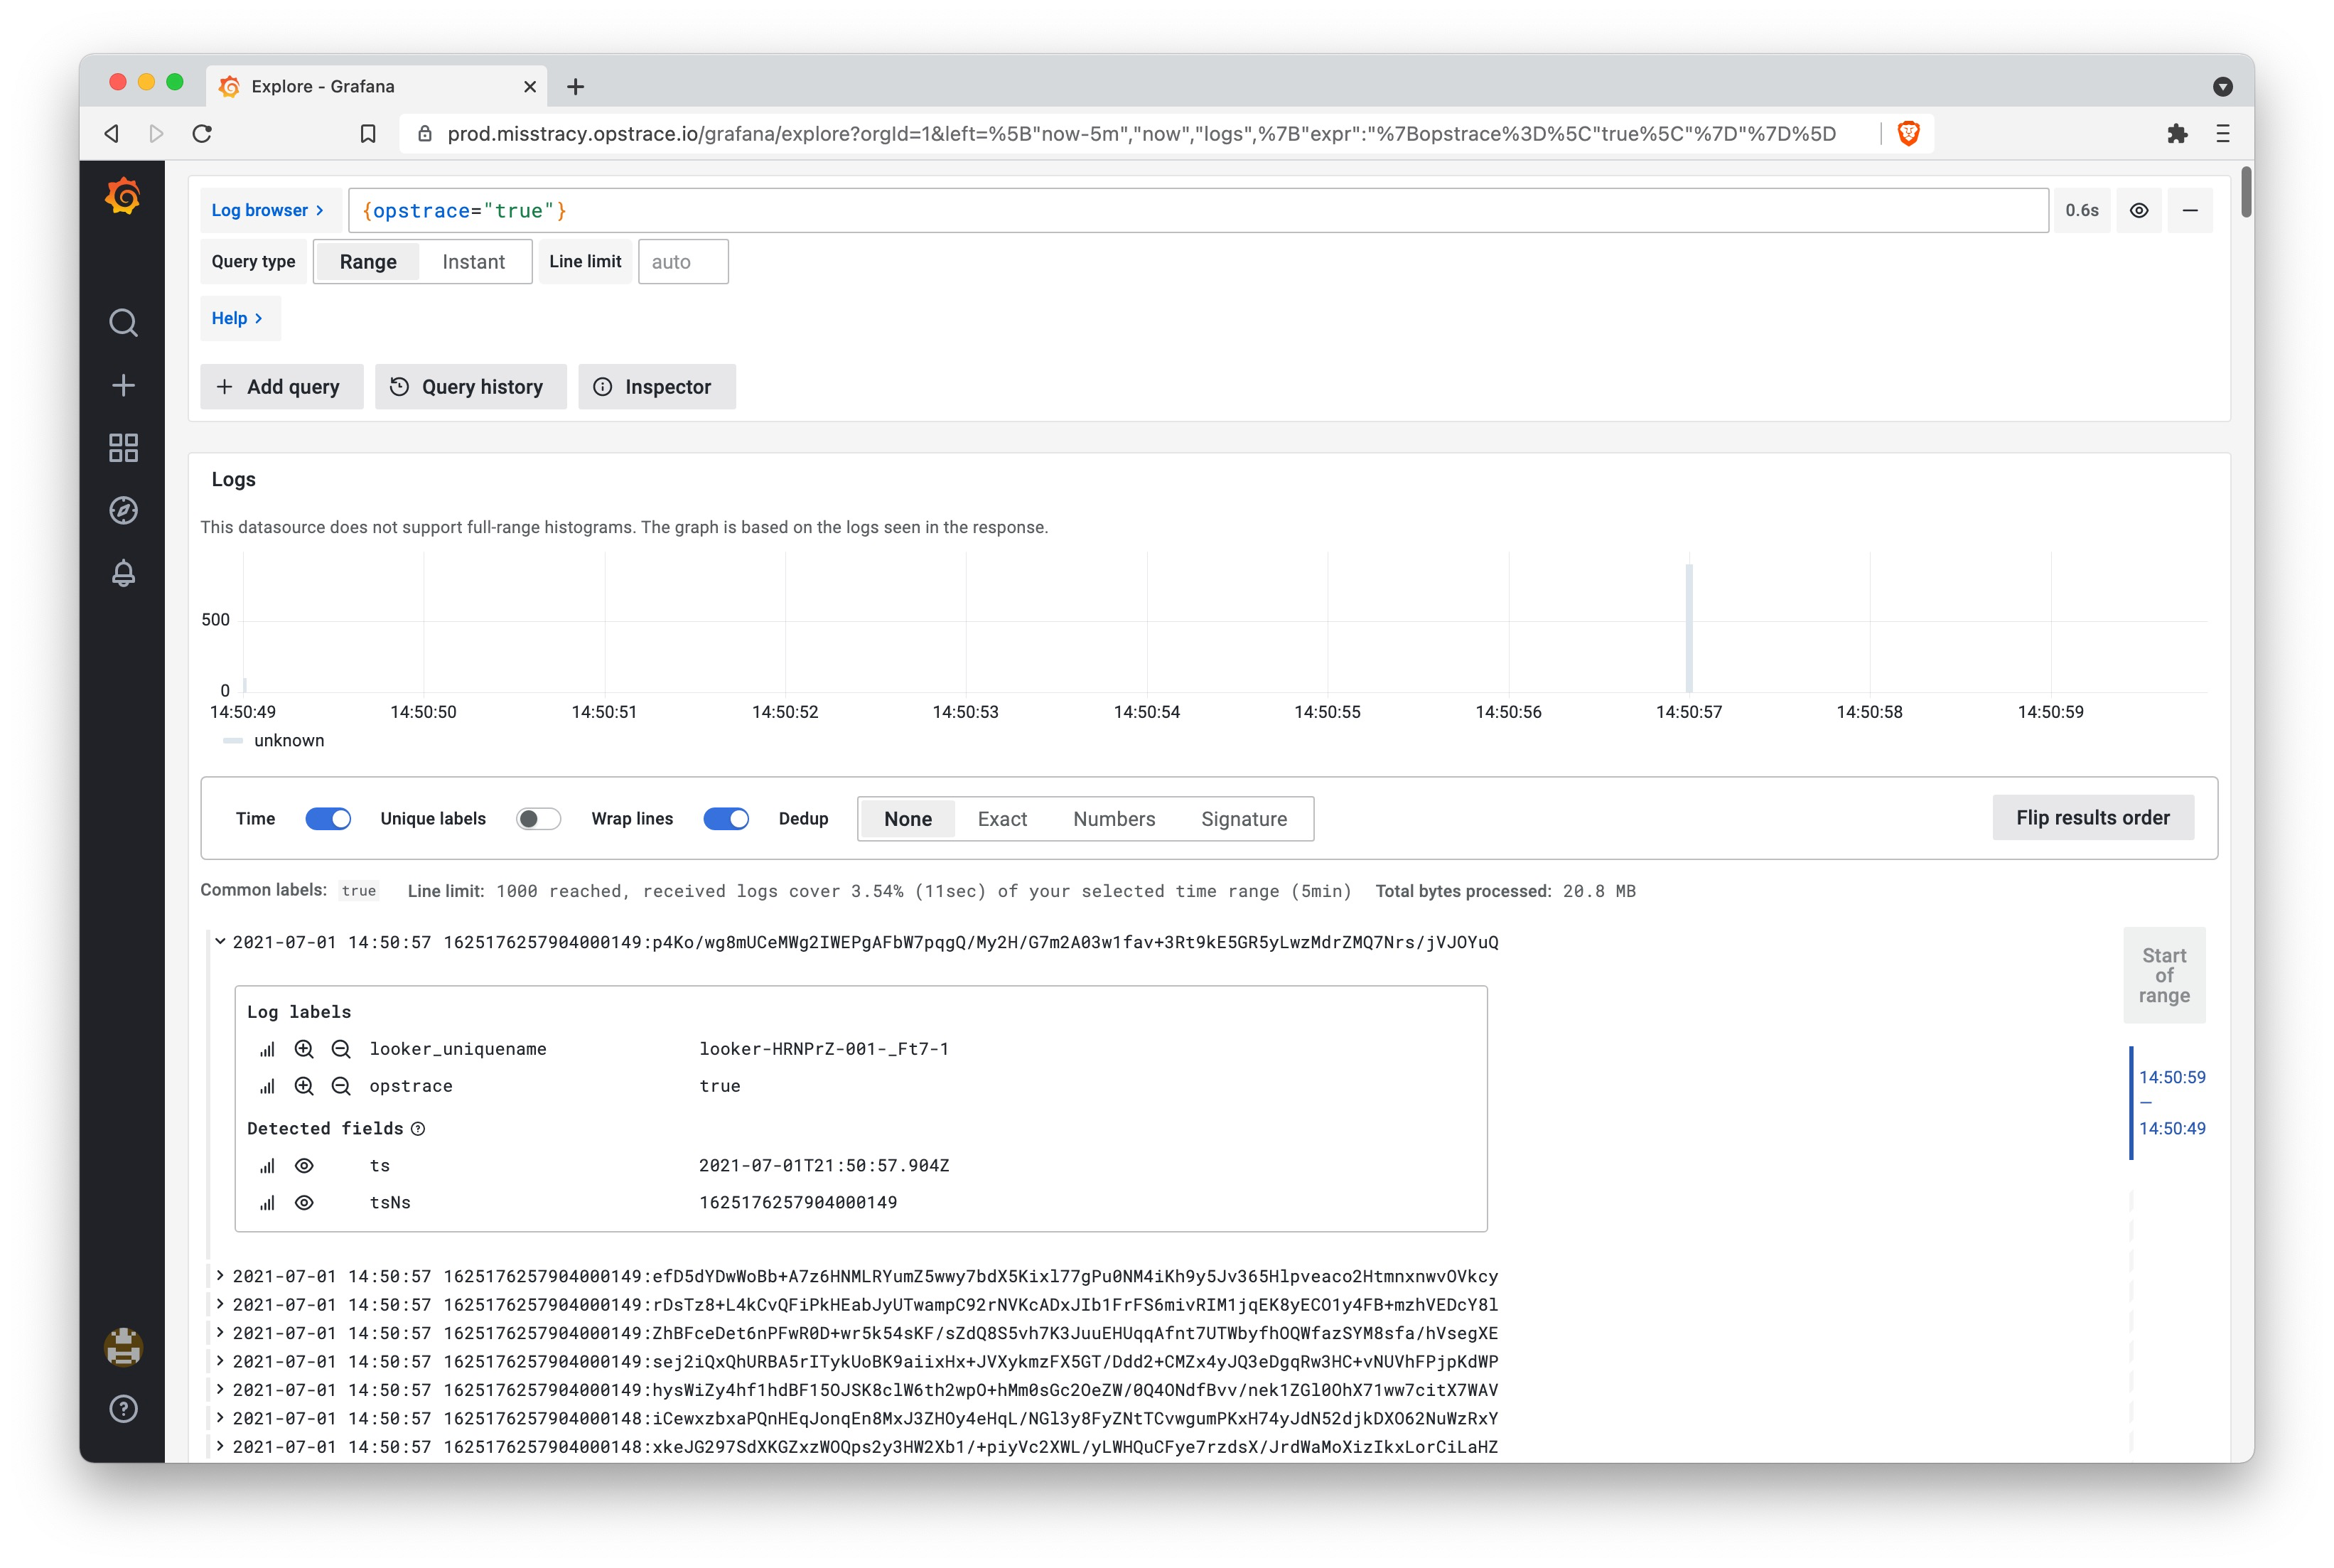
We start by sending dummy log lines to the prod tenant of our Opstrace
instance, using our load-generation tool,
Looker
[1].
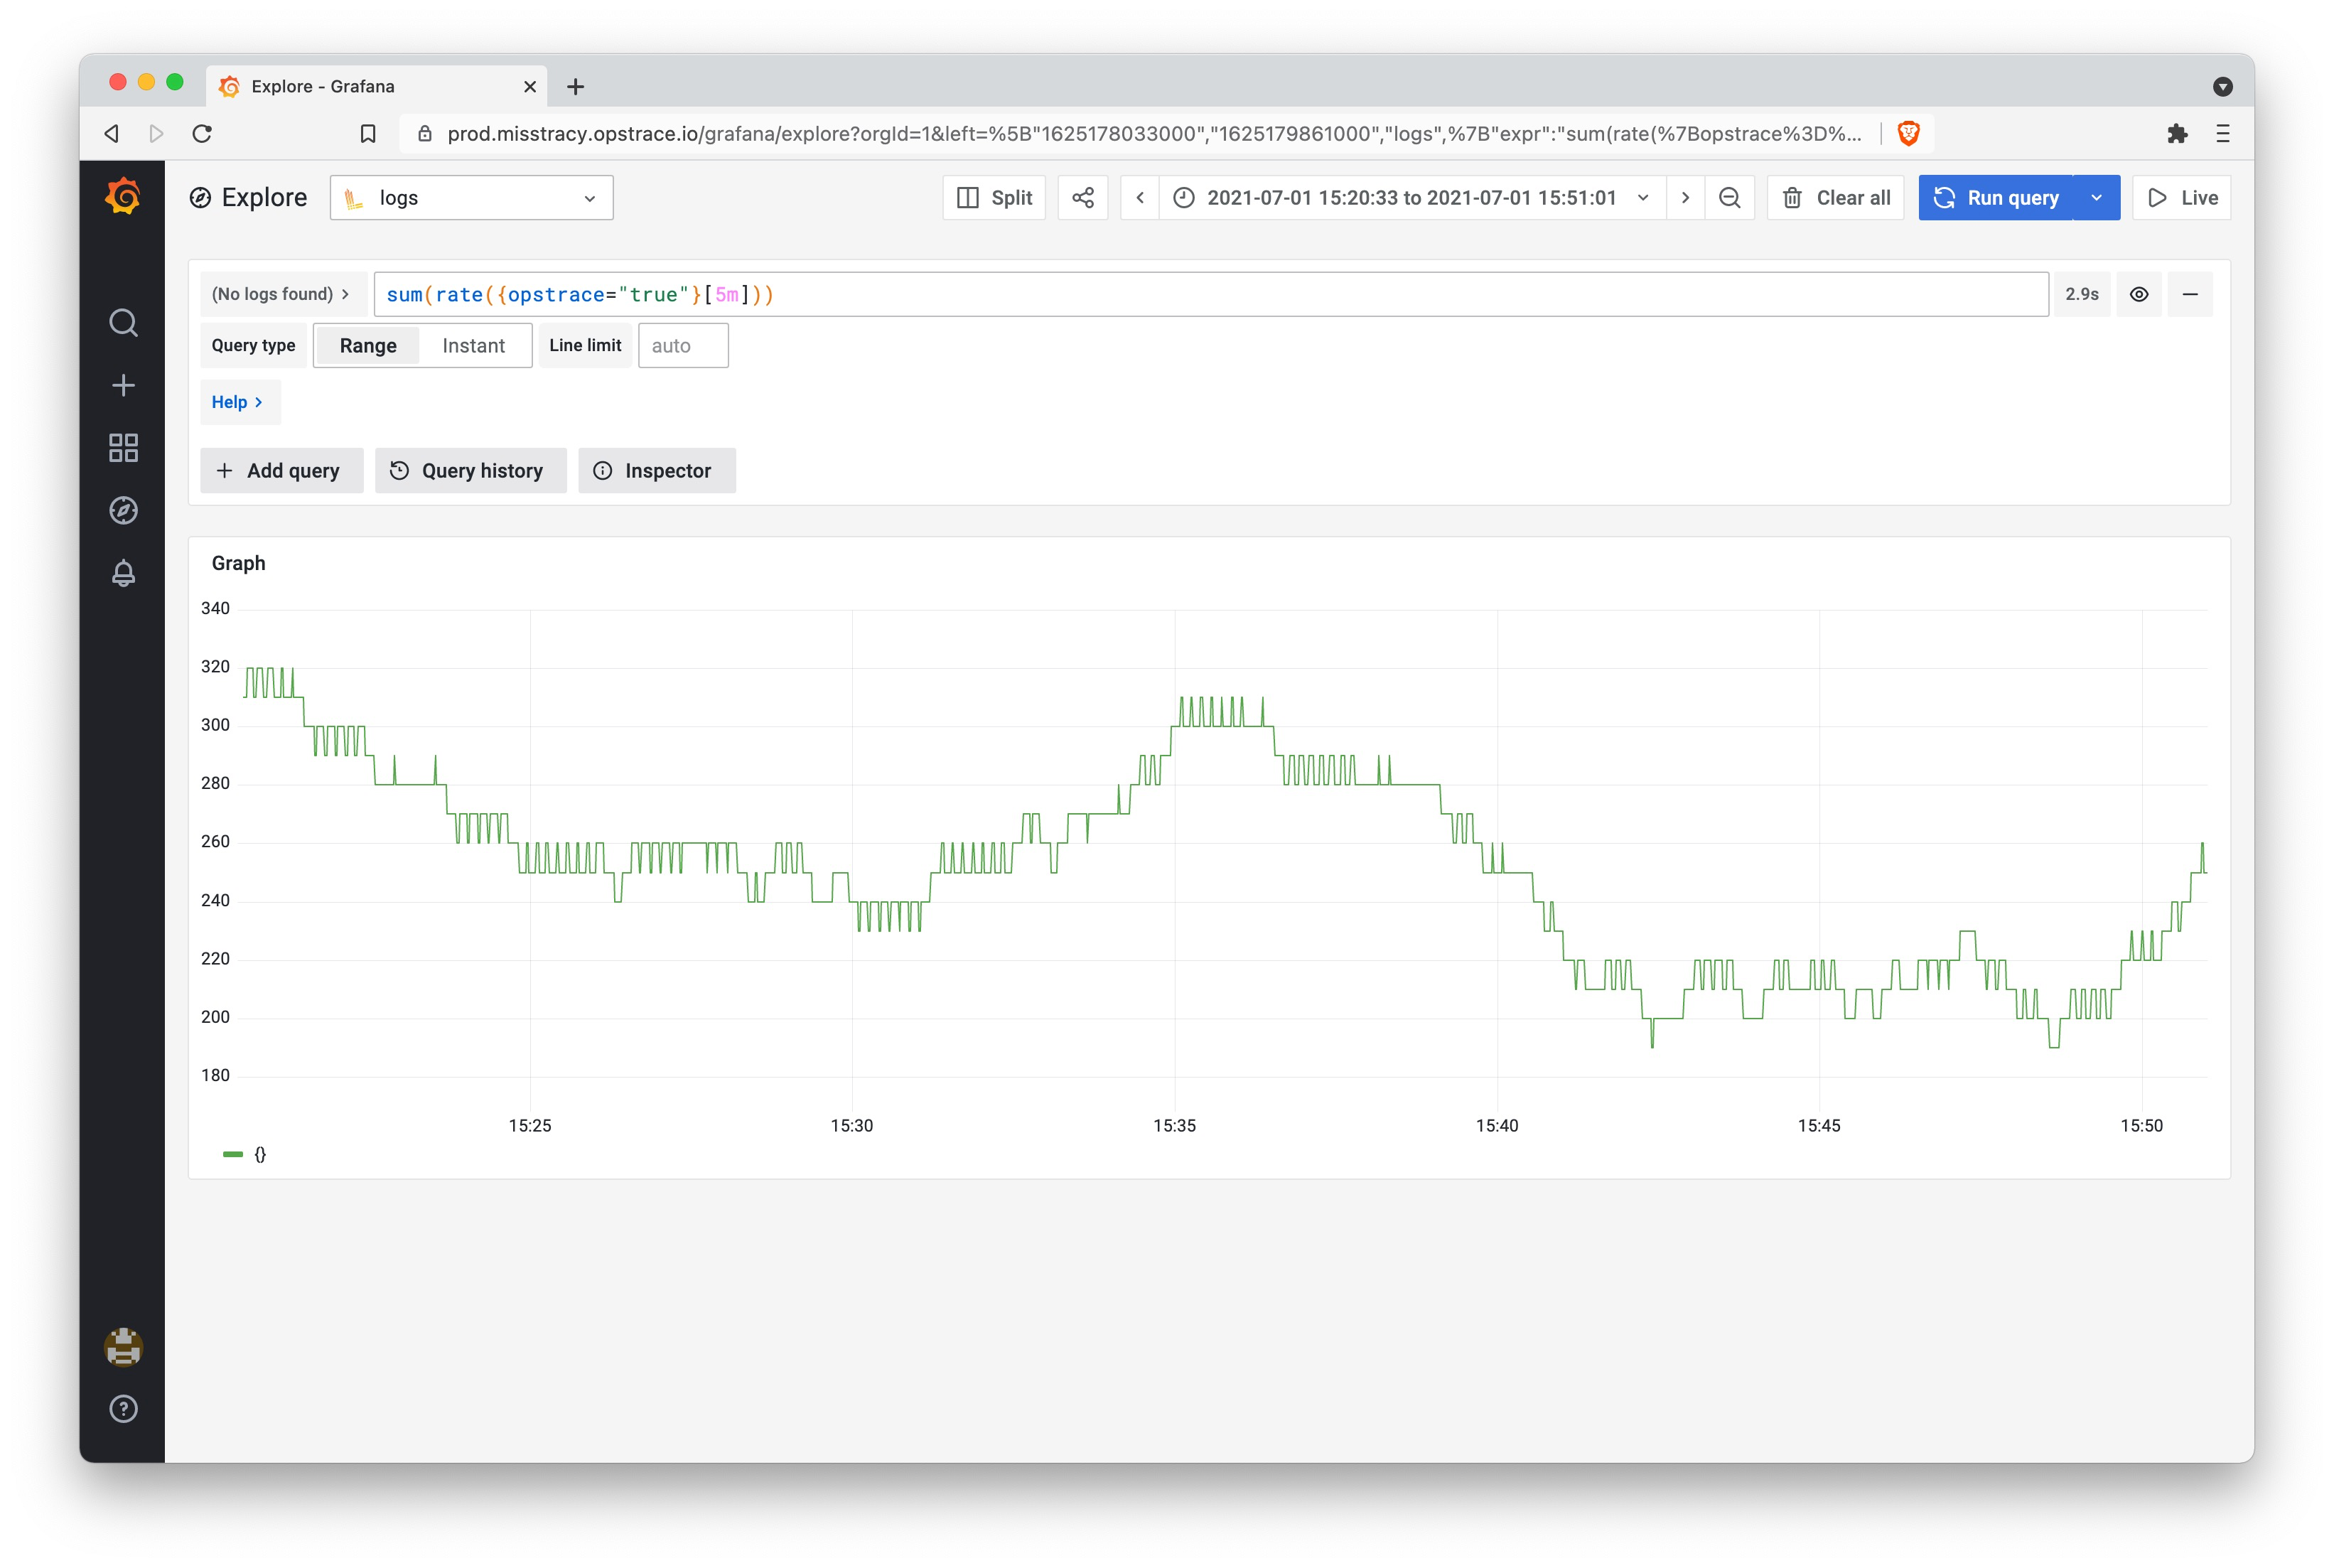
We can use the Explore view to visualize the incoming log messages as well as the overall rate of them using a simple LogQL function that sums the rate of incoming log messages. For anyone familiar with Prometheus queries, this should look very familiar:

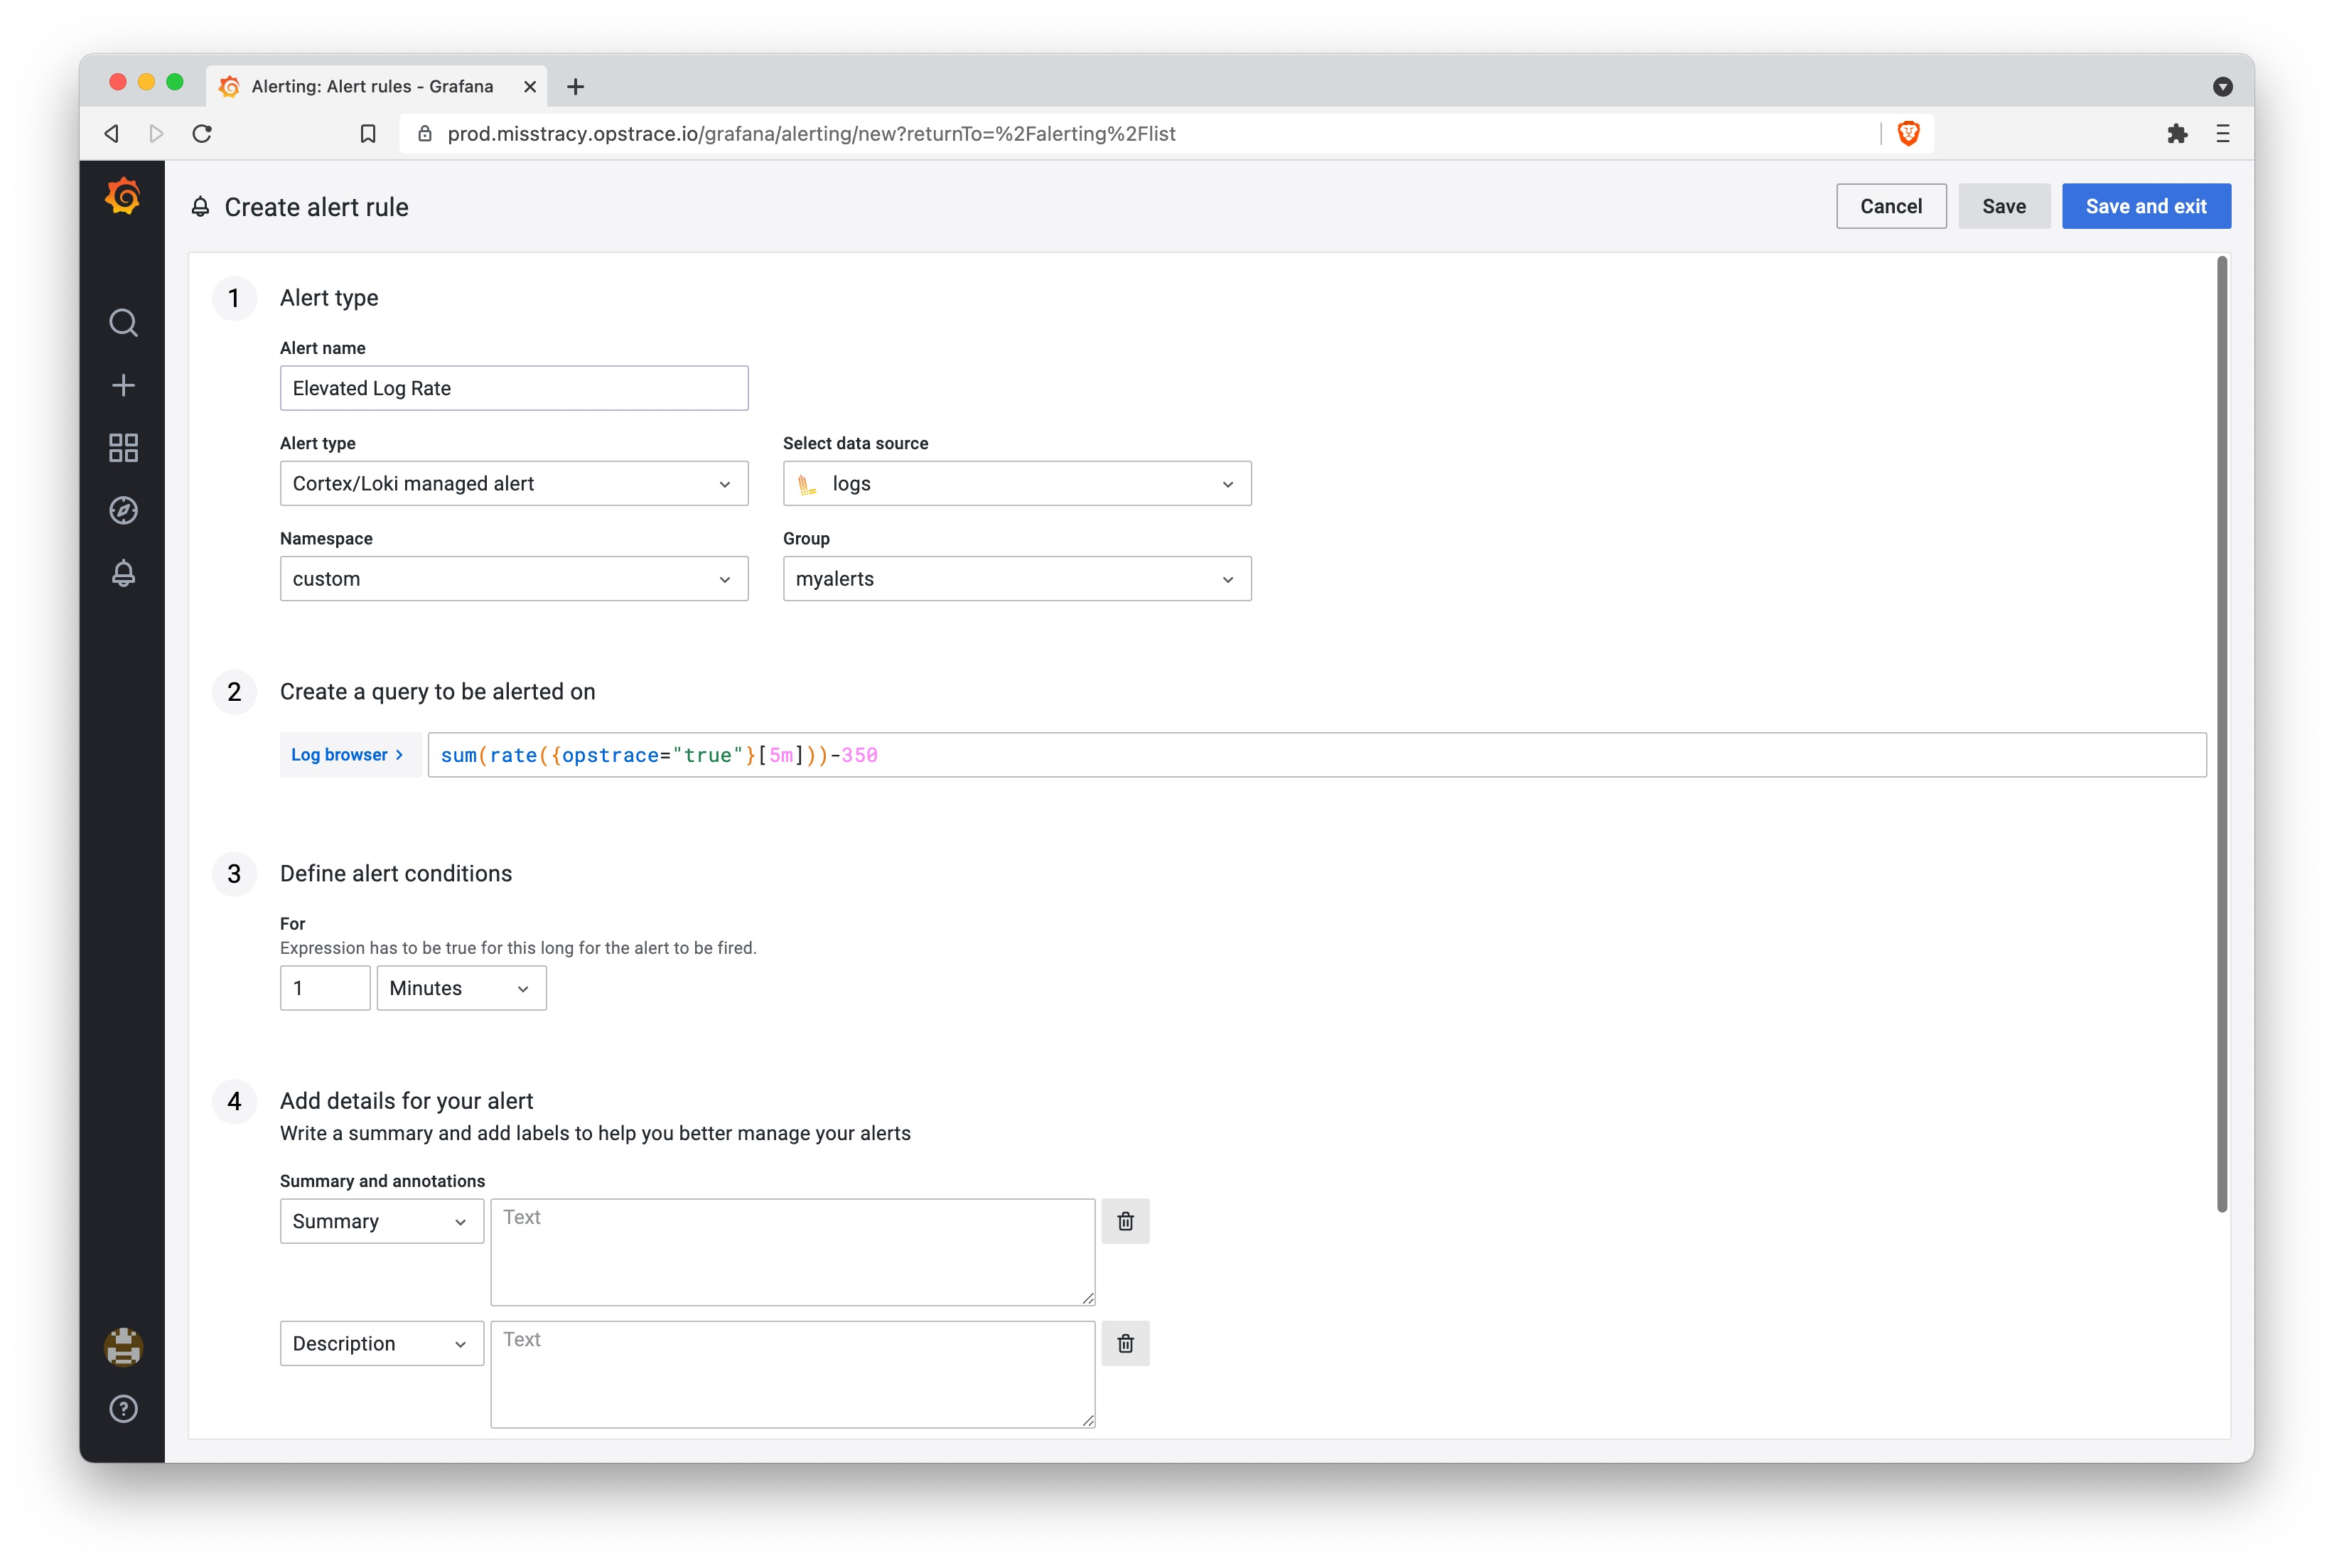
Step 2: Define Alert Rule
This part is rather simple, taking the query we had and defining an expression
that will fire an alert when the value is over 0:
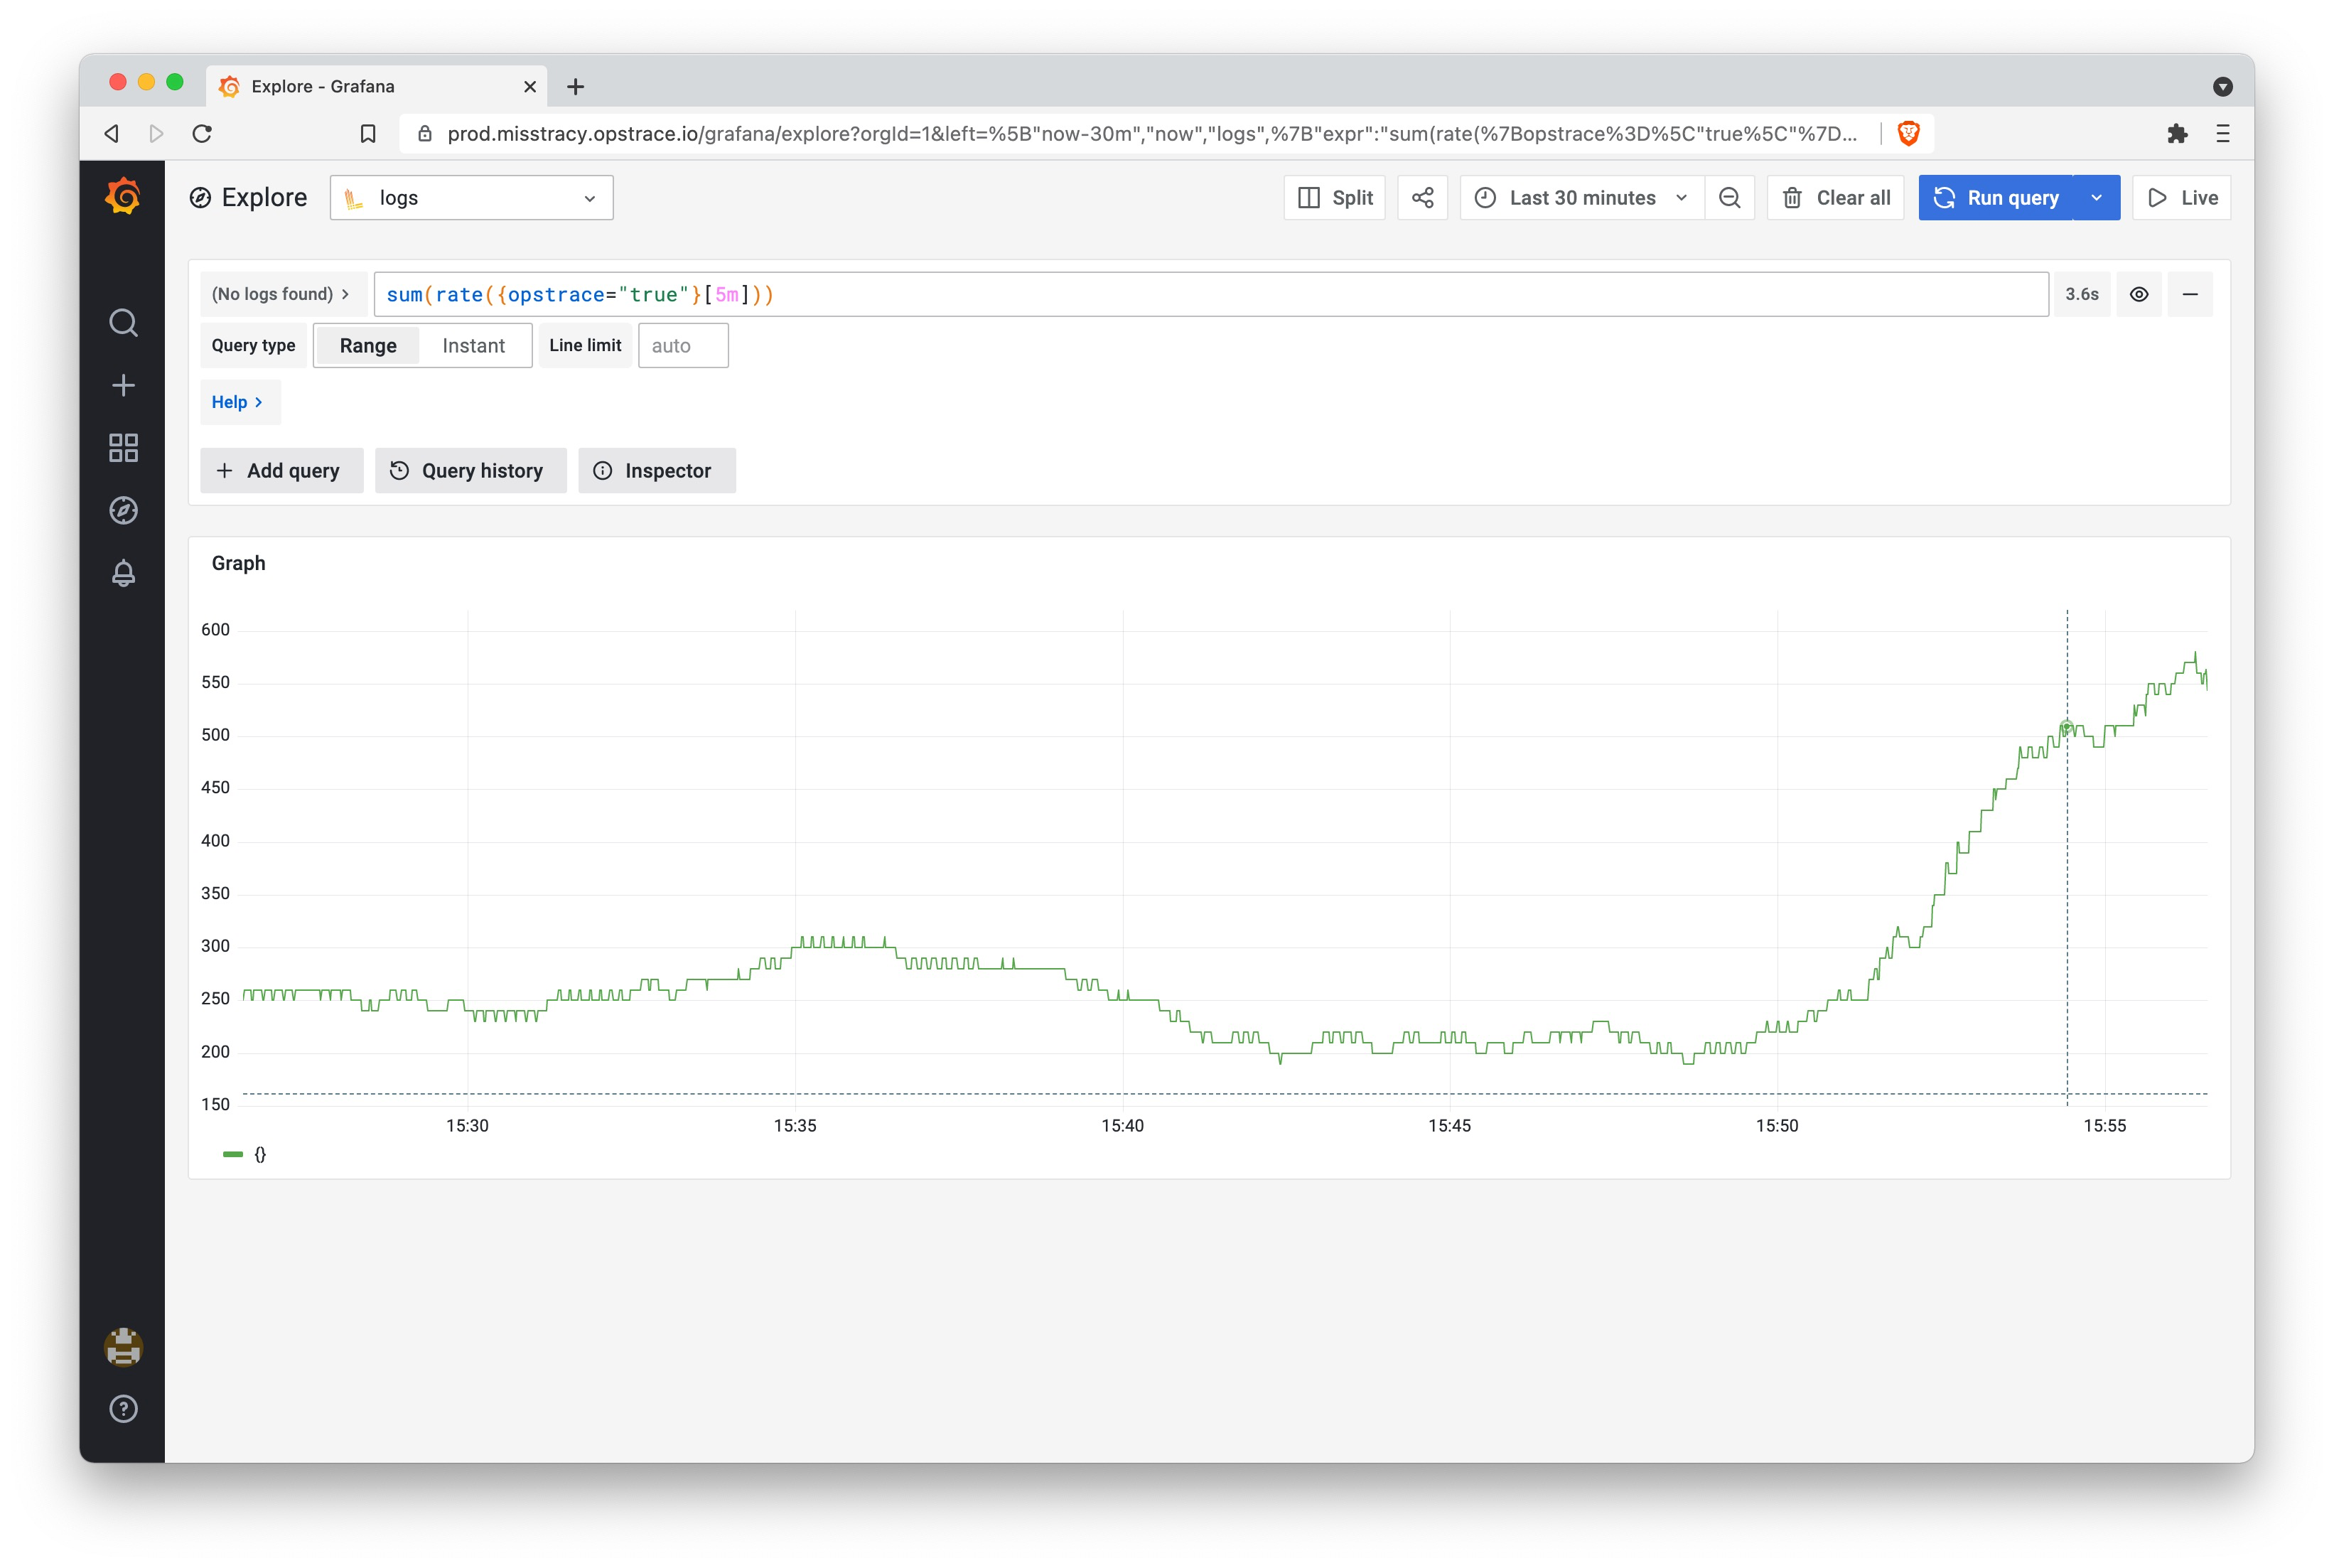
Step 3: Increase Dummy Workload
This part is pretty easy—just invoking a second instance of the looker
command. (An exercise left to the reader.) This will cause an increase in the
log message rate:
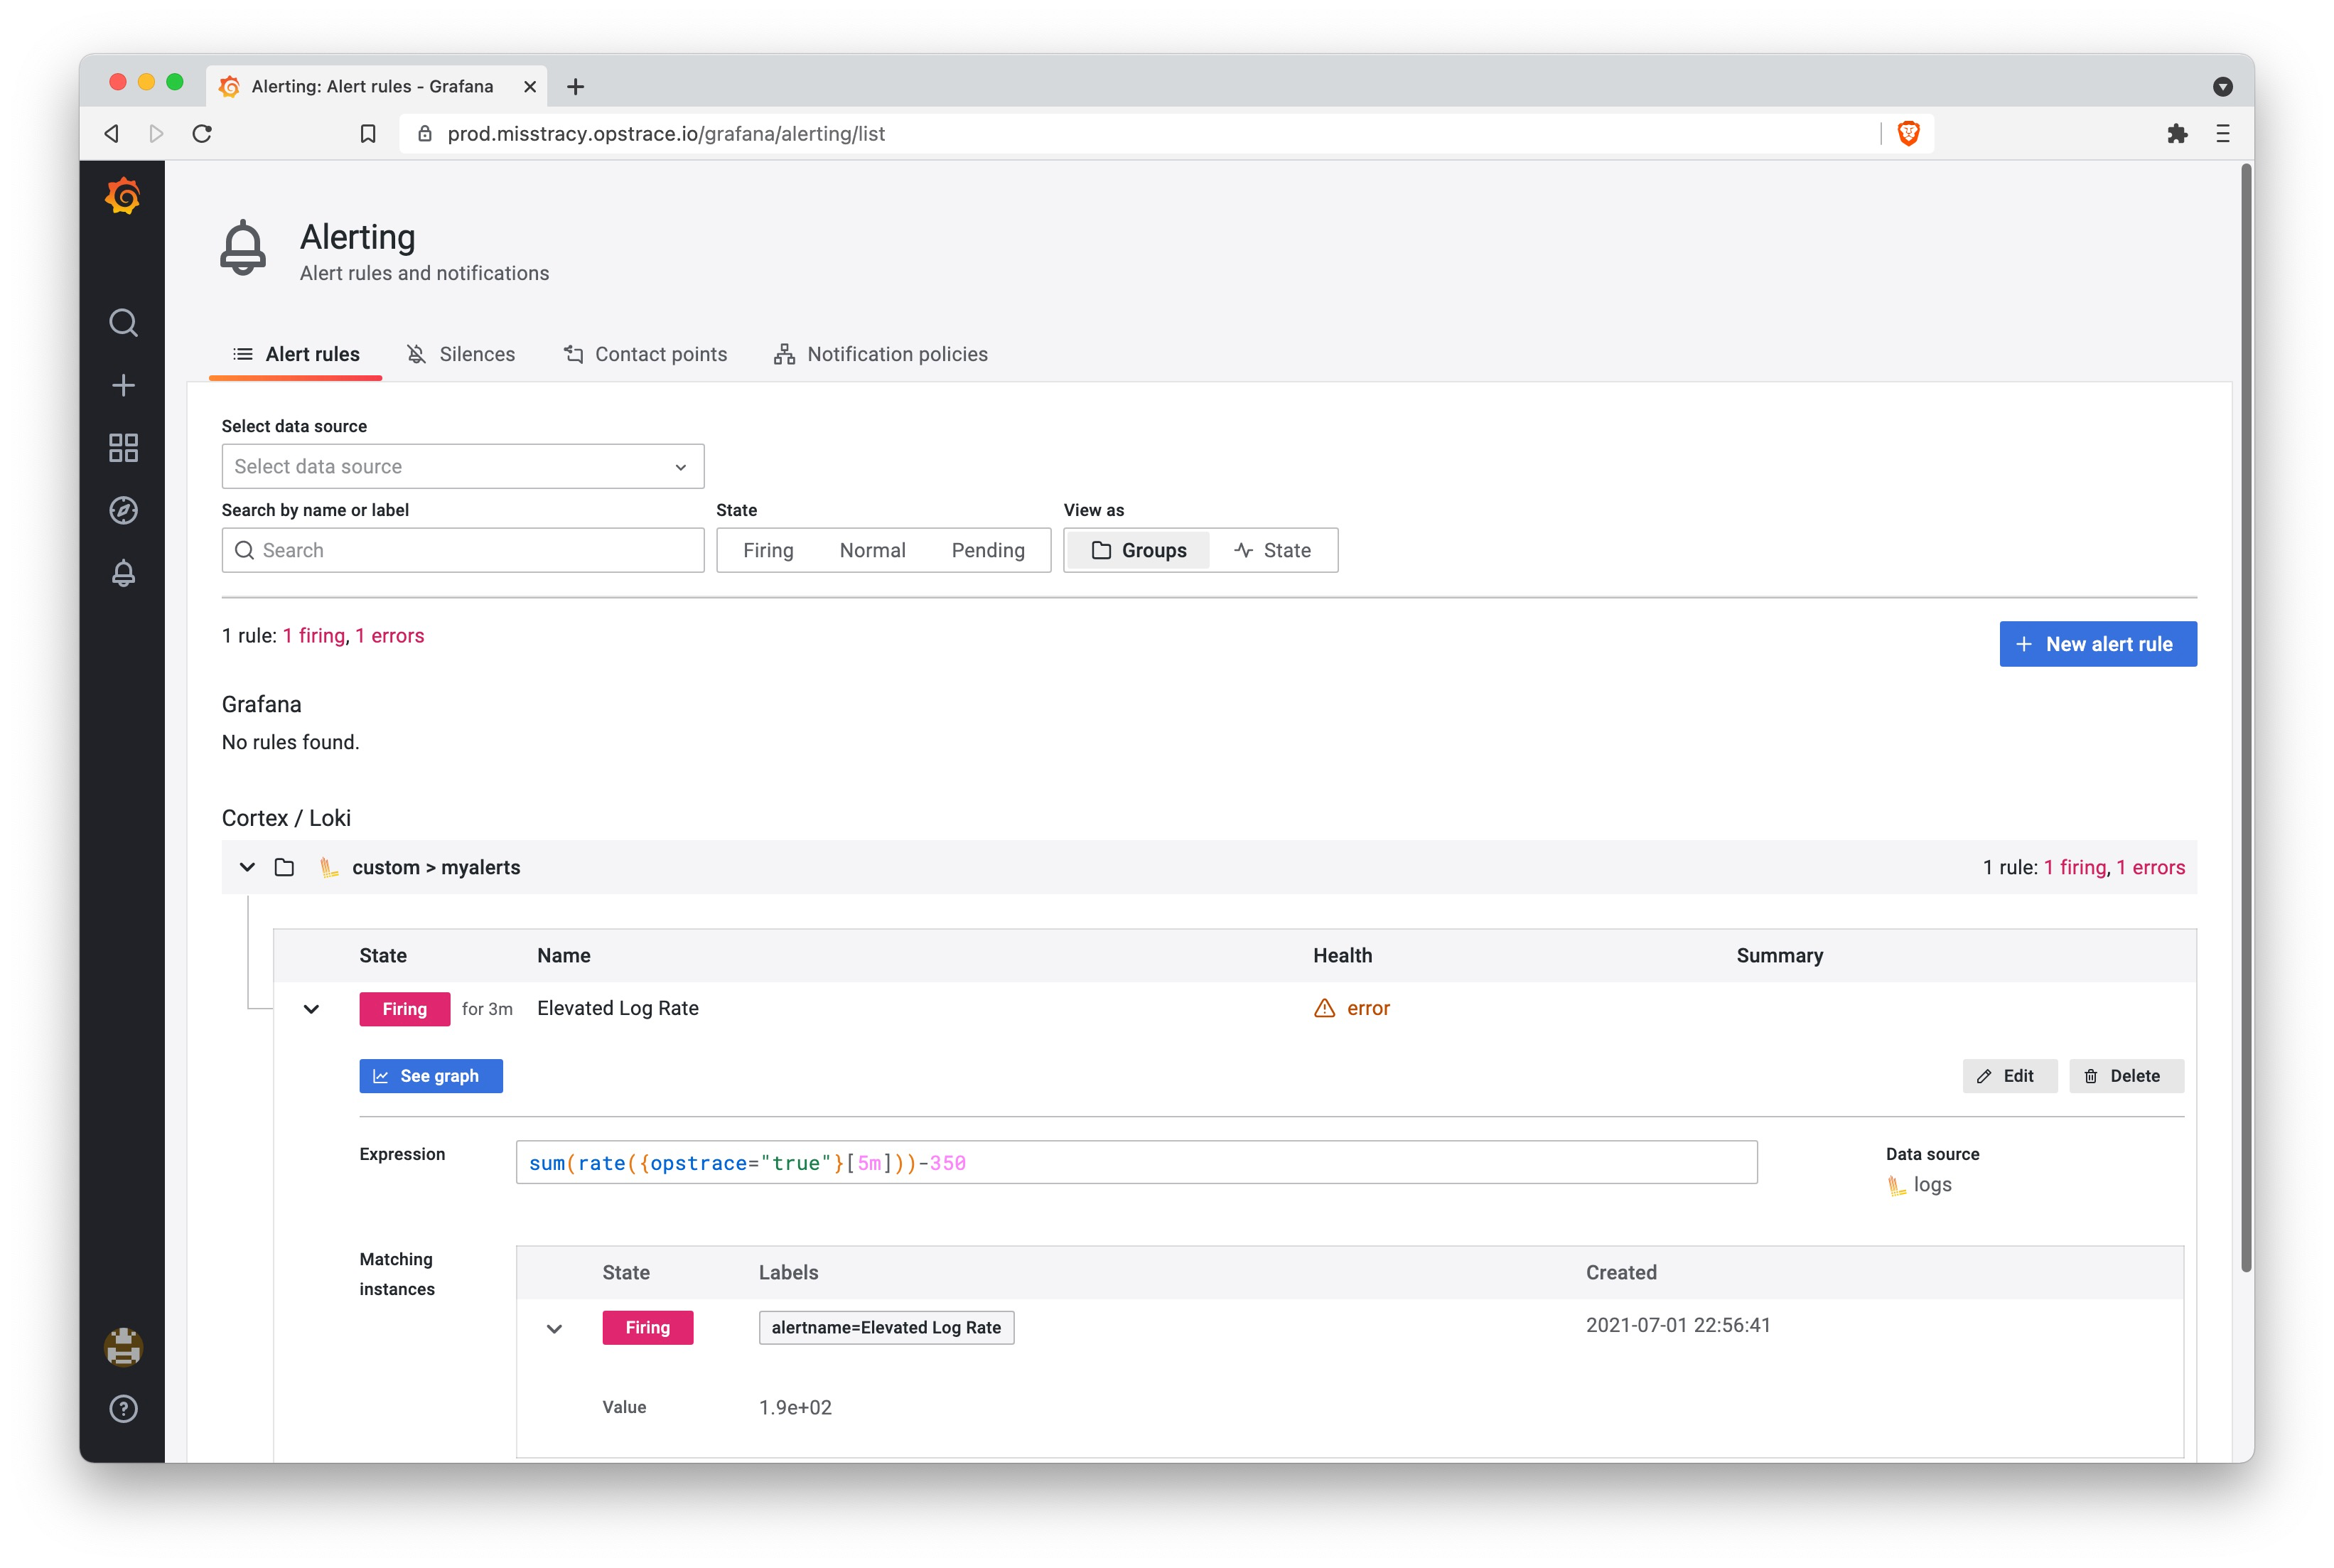
Step 4: Observe Increase and Alert Firing
Once the load increases, on the alert rules tabi, you will see the status change from "normal" to "pending" to "firing." Mission accomplished.
Here in example 2, we've defined a log-based alert for the dummy logs we've sent
into our prod tenant. This is a simple example of how log-based queries can be
created and alerted on, but LogQL
provides many more
functions and capabilities
so you can craft far more complicated queries and make better use of your logs.
Because, under the covers, Loki is horizontally scalable, these queries can be
made performant over very large amounts of data, even though it does not
maintain an (expensive) index like other log storage engines.
We hope you've enjoyed this walkthrough and that you'll give it a try on your own. Just go through our quick start to get an Opstrace instance of your own, and you can start playing this dramatically improved alerting user experience.
[1] Command to generate a dummy logs workload with looker.
> while true; do docker run -v $(pwd):/rundir --net=host \opstrace/looker:7c21e81c-ci looker \https://loki.prod.<my-name>.opstrace.io \--bearer-token-file "./tenant-api-token-prod" \--http-server-port 8903 \--stream-write-n-fragments 10 \--skip-read \--max-concurrent-writes 6 \--label opstrace true \--n-concurrent-streams 12 \--n-entries-per-stream-fragment 50 \--n-chars-per-msg 100 \--n-cycles 1 ; done