


Jun 10 | 17 min read
Scale Testing Cortex Writes with 200M Active Series
Nick Parker
Cortex performs well for large-scale writes but requires expertise to configure and operate properly
Our goal for Opstrace is to build an open source observability distribution that works for you out of the box no matter what scale you’re running at—from a young startup to the most demanding large-scale organizations. The components underlying the distribution present a significant number of configuration values that need to be tuned together to reliably meet scale anywhere in that range. To manage this complexity, we are working toward what we call bounded configuration (more on this in a future post) that provides sane defaults that may be changed, while also protecting the system.
We have plenty of experience running small-to-medium size instances of Opstrace, and are now starting to test larger (much larger) instances to support the biggest companies. This post covers work we’ve recently done to stress test our metrics support, provided internally by Cortex. It is the first in what will likely be a series of posts.
Cortex can be thought of as a heavily modified Prometheus, effectively running it as a distributed system. It effectively makes Prometheus horizontally scalable, highly available, with reliable long-term data retention. To accomplish this, Cortex adds features to handle a scalable storage layer (via Thanos) and manage configuration across many nodes. If you look at the Cortex Go code, you will find many places that import Prometheus as a library and call into it directly. After all, why reinvent the wheel? At the same time, Cortex is under significant, active development and is moving quickly to support production-scale workloads.
Admittedly, these clean-room benchmarks and stress tests are ultimately just exercising the scenario under test, which might not align with the real world. It’s impossible to make a single test that exercises all possible workloads, so we focused on crafting a write-path test that seemed reasonable. We explicitly acknowledge the tradeoffs we accepted along the way. In this test, we focused on the case of a large number of distinct metric series being written against a single Cortex tenant, seeing what issues arose along the way. An anti-goal for us was to optimize the underlying resource footprint, so we gave Cortex as many resources as it wanted. This allowed us to see what issues would arise when system resources were not the bottleneck.
What follows describes the process and findings in detail. You can reproduce these tests using the tools and configurations we’ve published in a test-infra repo.
Setting up the tests
First, we will describe how we set up the tests. Our hope here is that you can reproduce this test and the findings, should you choose to. Following that, we will describe the various issues we encountered along the way. (If anyone else has done a similar experiment, we’d love to hear what issues you experienced!)
Run a simple, large, reproducible, write workload
In this series of tests, we will define a sizable faux write workload to send to Opstrace.
We will focus on continuous write loads for this testing and not worry about read loads.
Realistic metric read loads are a bit harder to fabricate than metric write loads since there is tremendous variability—a lot can depend on the kinds of queries performed over what time periods/with what frequency (resulting payload size, aggregations, and other functions used, etc.). Instead, we focus on the intensive side of writing the metric data since scaling this is in itself a significant, non-trivial concern.
Use standard software to generate ~authentic load patterns
We chose real software to generate the most realistic workload possible—for example, using Prometheus itself to scrape dummy generated metrics. By using Prometheus itself, we have the most likely client used to send data into Opstrace. In our setup, each Prometheus instance scrapes dummy metrics and “remote writes” them to the Opstrace data API using the tenant bearer token file as authentication proof. The layout looks like this:

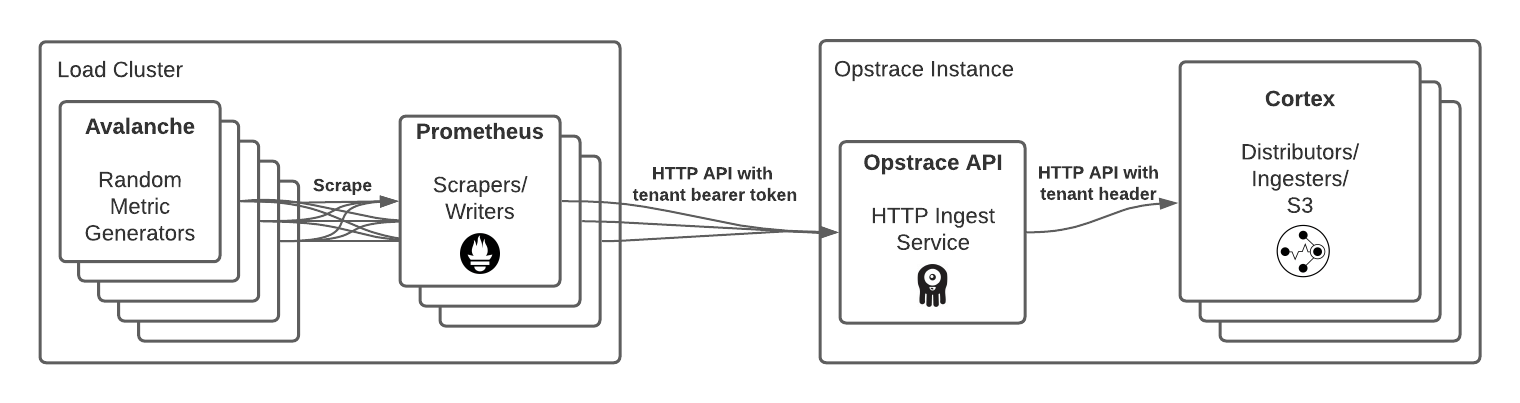
The dummy metrics were generated using a combination of 100 Avalanche instances.
Avalanche is
a simple, highly configurable, open source
random metric generator that presents a Prometheus/OpenMetrics endpoint. We
configured ten Prometheus instances (v2.26.0 with
remote_write configured)
to scrape all of the Avalanche instances and remote_write the data to the
Opstrace data API, with unique labels added for each prom instance via relabel
rules (to avoid duplicate series at the destination). This structure had a
multiplicative effect on the output, spreading it across multiple Prometheus
writers, avoiding any single writer becoming a bottleneck. Similarly, scaling
the load could be done by adding and removing Prometheus instances.
In the load cluster, we ran the 100 Avalanche instances on 50 t3a.medium nodes (two Avalanche pods per node), and the ten Prometheus instances were each given an r5a.8xlarge node. We had tried running the Avalanche pods with four to a node, and this was fine under five Prometheus instances polling them, but with ten Prometheus instances, the Avalanche pods started OOMing. It turns out that Avalanche memory usage scales somewhat with the rate that it’s being queried - this was surprising to us, but wasn’t a priority to investigate as the t3a.medium instances were a fraction of the overall spend.
We used two Opstrace configurations with the same overall resource footprint, but one with half the instances and double the individual resources of the other one:
- “Nine Nodes”: Nine r5.16xlarge nodes, each with 64 vCPU and 512GB
- “Eighteen Nodes”: Eighteen r5.8xlarge nodes, each with 32 vCPU and 256GB
(See the opstrace/test-infra repo for the opstrace and eksctl configurations we’re using in this and other tests.)
The Opstrace instance used the default configurations as defined by the Opstrace Installer and Opstrace Controller. During testing, we saw issues with the default limits that were addressed by customizing them in Opstrace.
The resource footprints (for the load cluster and opstrace instance) were effectivley over-provisioned to make sure that the resource contention was not a factor in our tests. We intend to take on optimizing the hardware footprint and the workload in future iterations of this test. (See the “future work” sectcion below.)
Each Opstrace instance was then paired with its own load cluster (actually just
EKS). Avalanche has several configuration options to define what the generated
metrics look like. In our case, we went with 2000 distinct metrics, 100 distinct
series per metric, 10 labels on each series, and per-series values that changed
every 30 seconds. So each Avalanche pod produces 2000 * 100 = 200K distinct
series, and across 100 Avalanche pods, there were 20M distinct series. Each
series contained the names of the Avalanche pod that generated the metric and
the Prometheus scraper pod that sent it to Opstrace. This ensured that the
series did not appear as duplicates when arriving at the Opstrace instance.
Under this system, increasing and decreasing the load was accomplished by
increasing and decreasing the number of Prometheus scrapers.
Problems encountered along the way
A lot of the test was trial-and-error to see what worked… and what needed fixing.
Happily, we didn’t encounter any fundamental Cortex problems and instead spent most time tuning limits.
There was a fair amount of effort spent in the load cluster to ensure that both the Avalanche and Prometheus instances had the memory and disk that they needed to operate properly. One source of instability was initially using Deployments for the Avalanches and Prometheus instances and then including the pod name in the metrics sent to Opstrace. As a result, when an Avalanche or Prometheus pod restarted, it would lead to a whole new set of metric series from Opstrace’s perspective; for example, a single Prometheus instance restart could result in 20M new series. To resolve this, we switched to running the Avalanche and Prometheus pods via StatefulSets, simply so that their pod names would remain stable across restarts, and therefore not generate “new” series from the point of view of Cortex. (Avalanche can also be configured to cycle series on some interval, which allows us to more carefully control when new series are introduced.)
On top of this, the Prometheus pods still needed some
local storage despite
being configured to remote_write and little else. A persistent volume was
provided via the StatefulSet, but it was rm -rfed on pod restart to avoid
wasting time on recovering prior local data. This was another deviation from the
real world for the sake of practicality.
In Cortex, the main issue we found throughout the test was ingester p90/p99 write latency increasing drastically whenever new series were added. The latency would go from a baseline of a few milliseconds to upwards of two or three seconds. When this happened, ingesters would develop a backlog of Push requests that often brought down the ingester with an OOM. The ingester then needs to spend several minutes recovering its write-ahead log, and if a second ingester goes down during this interval, then metrics may not be ingested due to a lack of quorum across instances. In testing, the ingesters would sometimes be unable to catch up under load and would just OOM loop continuously until the test load was turned off.
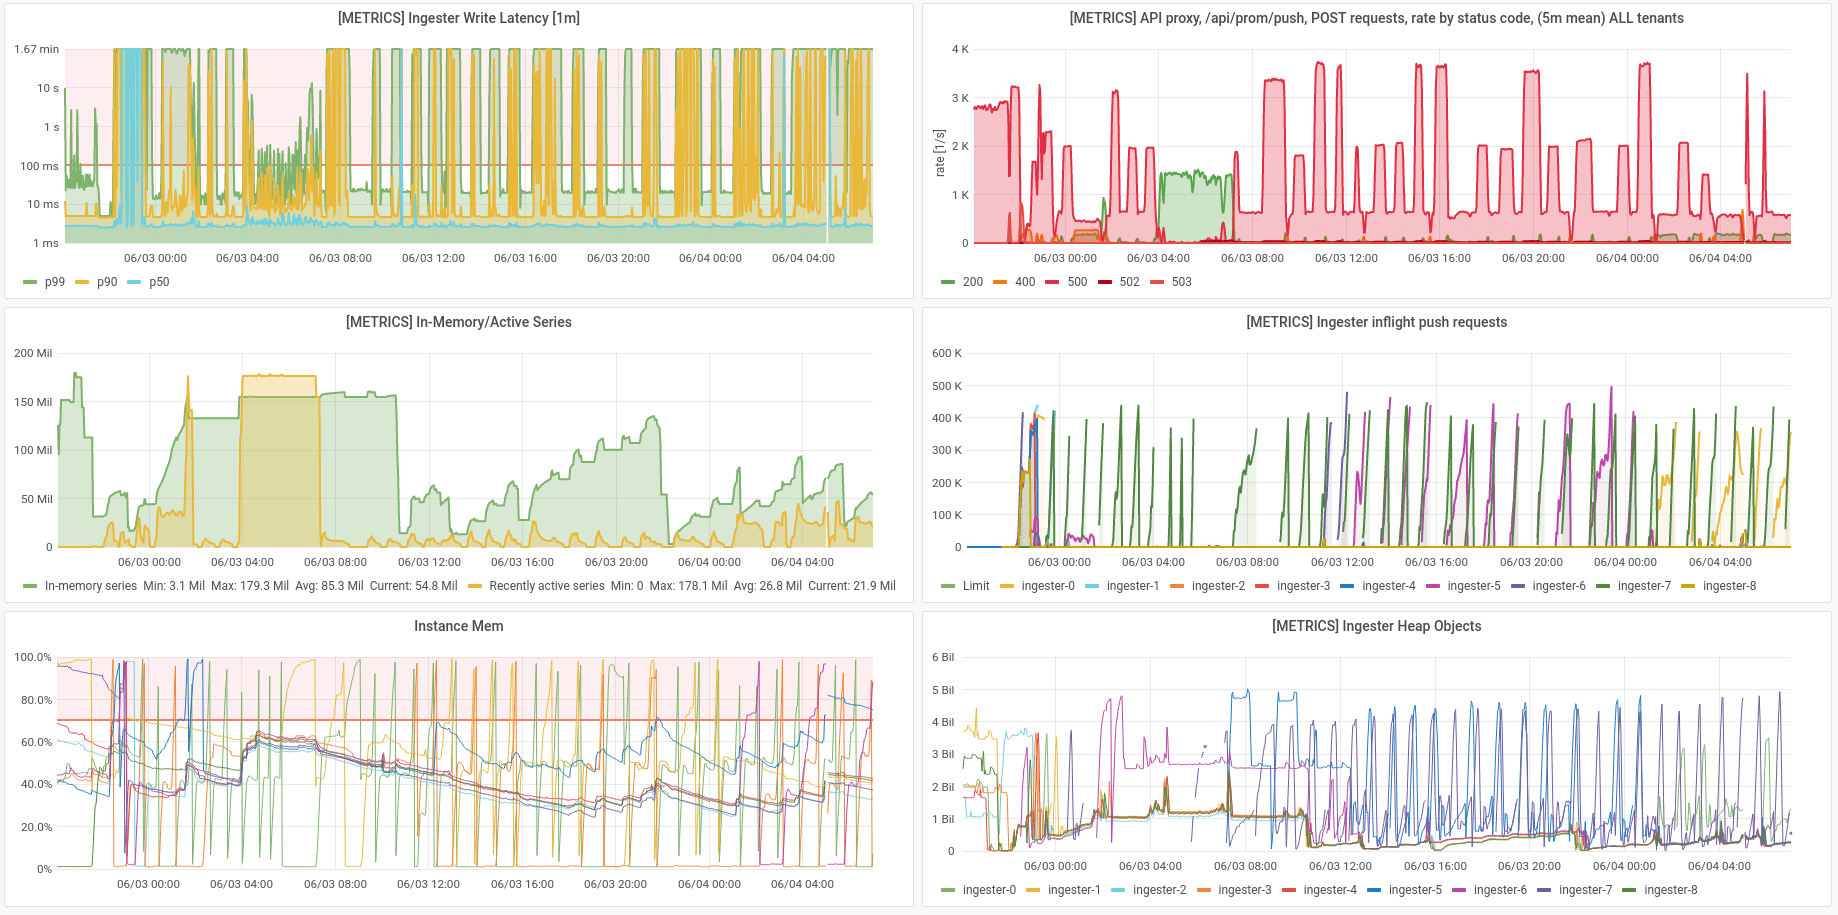
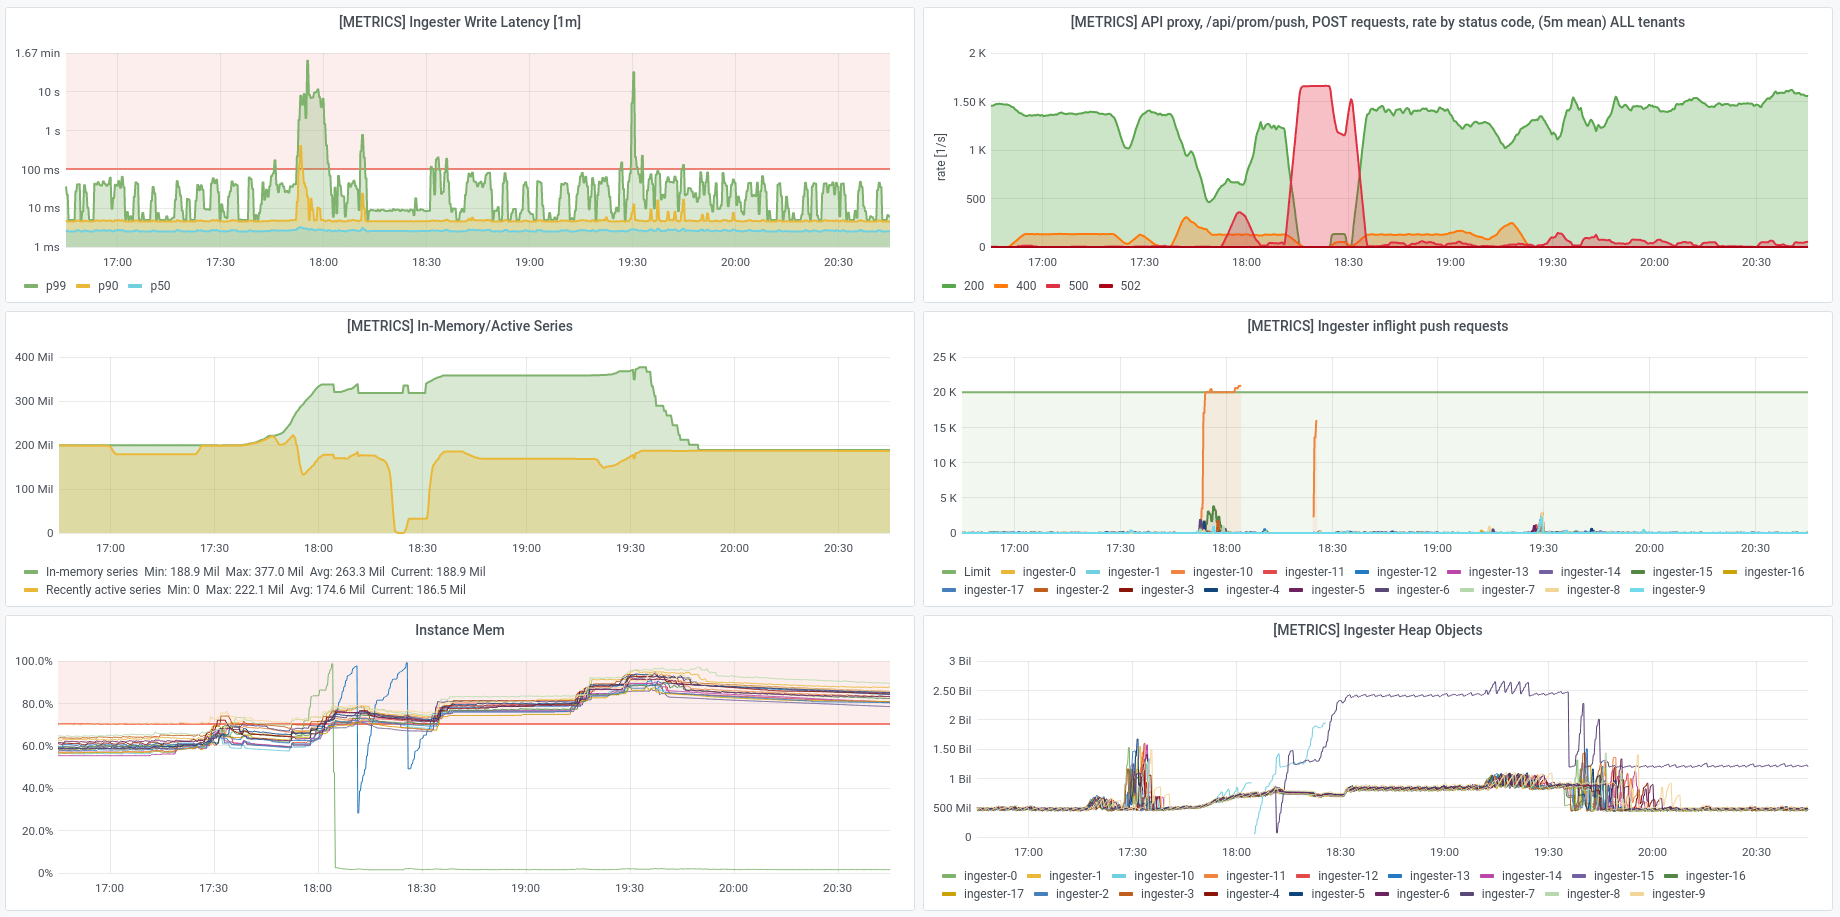
For example, see the following dashboard. This is from a point early in testing, where for several hours, write latencies stayed high, ingesters OOM-looped, and metrics were rejected with 500 errors. In this case, the ingesters are being prevented from making much progress because they’re OOMing so quickly. You don’t need to dig into the details here yet (see footnote[1] for panel info), but it was clearly a bit of a mess:

This situation was resolved by configuring the ingesters with a
recently added max_inflight_push_requests option
to cap the number of pending requests. The default value is 0 for unlimited.
With this setting, the ingester will respond to push requests with an HTTP 500
error when the cap is reached, but it is no longer prone to OOMing and needing
to spend several minutes recovering its write-ahead log.
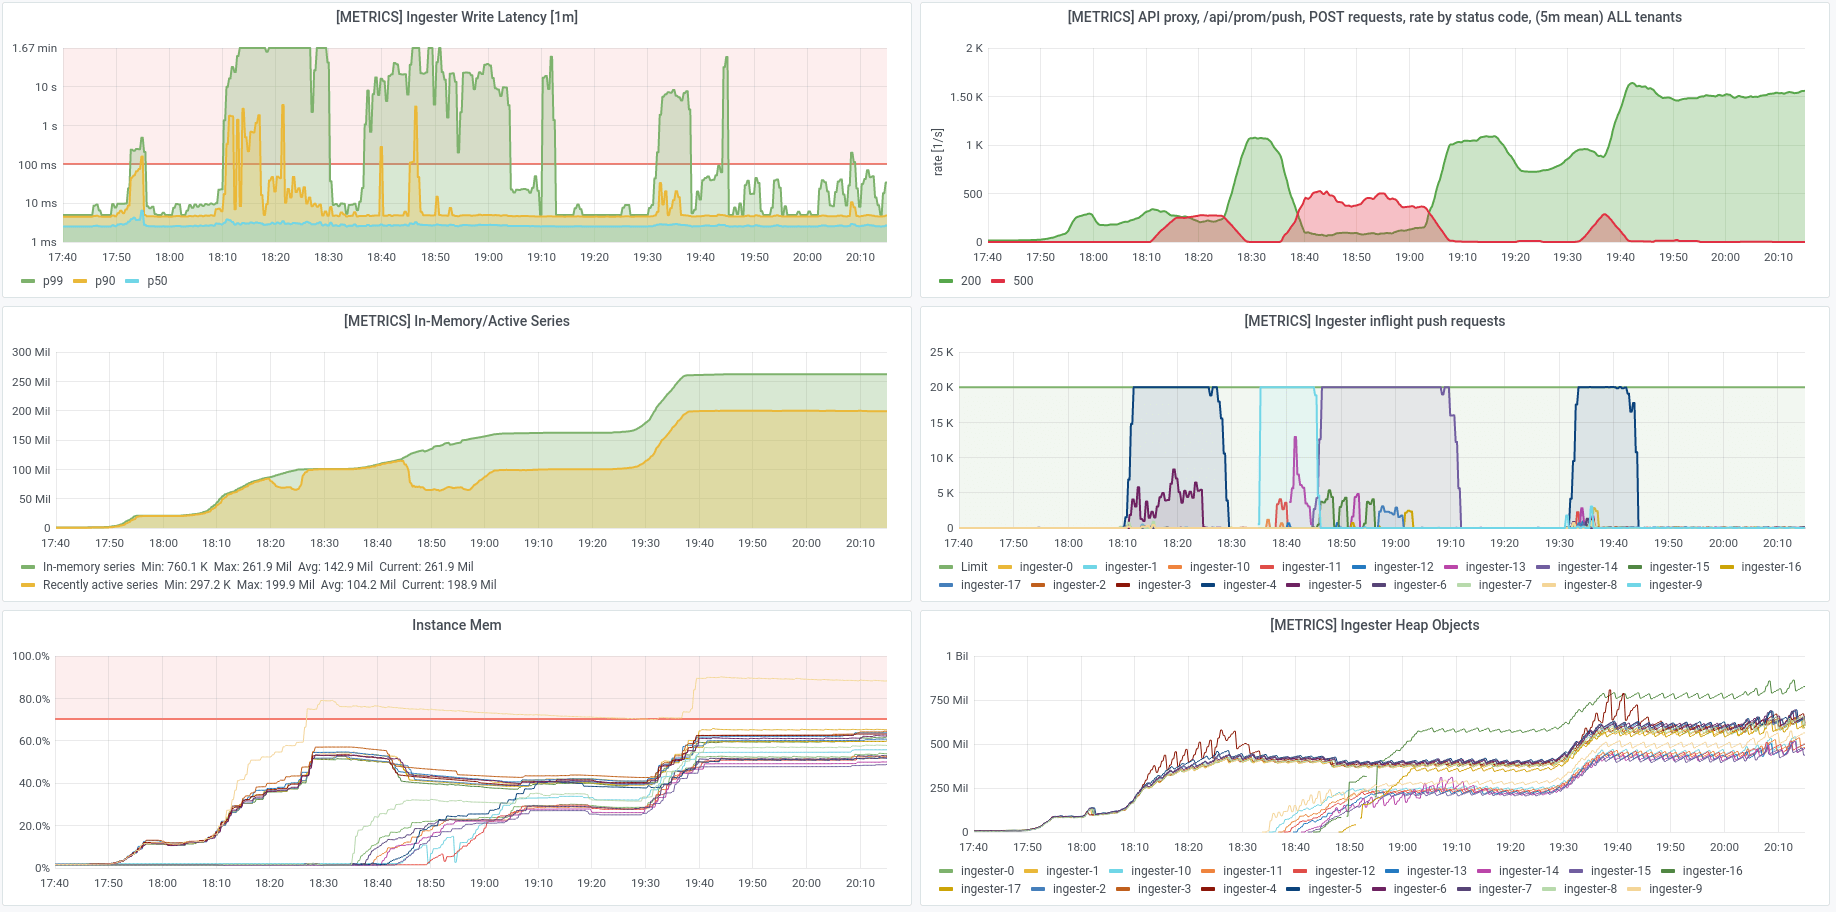
In this dashboard from the same cluster, we can see the effect of applying a 20k
limit when all 200M series are reset to have different labels via the
Avalanche series-interval option.
The write latency still increases, but the ingesters are able to reject requests when their backlogs are full and they are no longer OOMing. Instead, they stop at 20k pending requests and reject the rest with an HTTP 500 error. Eventually, they are able to clear the backlog of 200M new series and resume working normally.

In practice, this shouldn’t be a common scenario. For example, Opstrace by default caps total series counts at 5M per tenant [2]. But here we are explicitly trying to stress the system with a large number of series, and we are relabeling 200M series at once.
In a separate cluster with twice the nodes at half the size, the same 200M series reset resulted in a significantly shorter disruption, now only lasting a few minutes.
When the series began to relabel, we saw that the in-memory series count started to rise.
Then, as the old series expire, the in-memory count begins to fall back to the 200M level again.
The node memory does approach the 100% mark but backs off before hitting an OOM threshold.

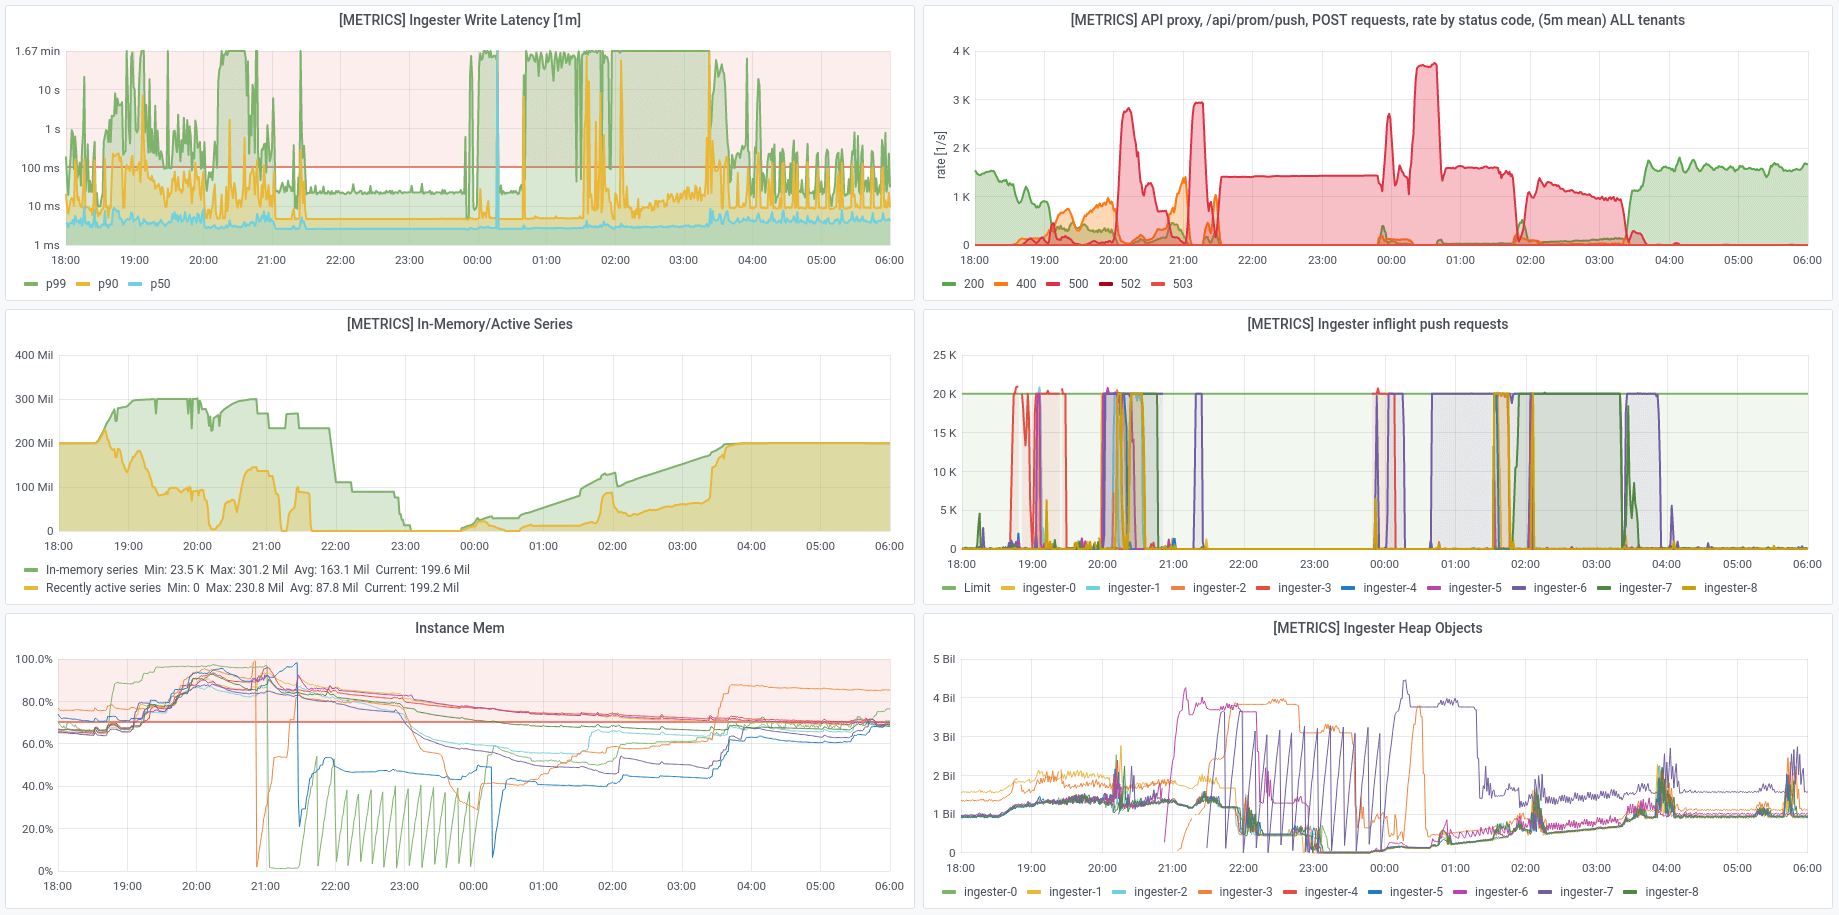
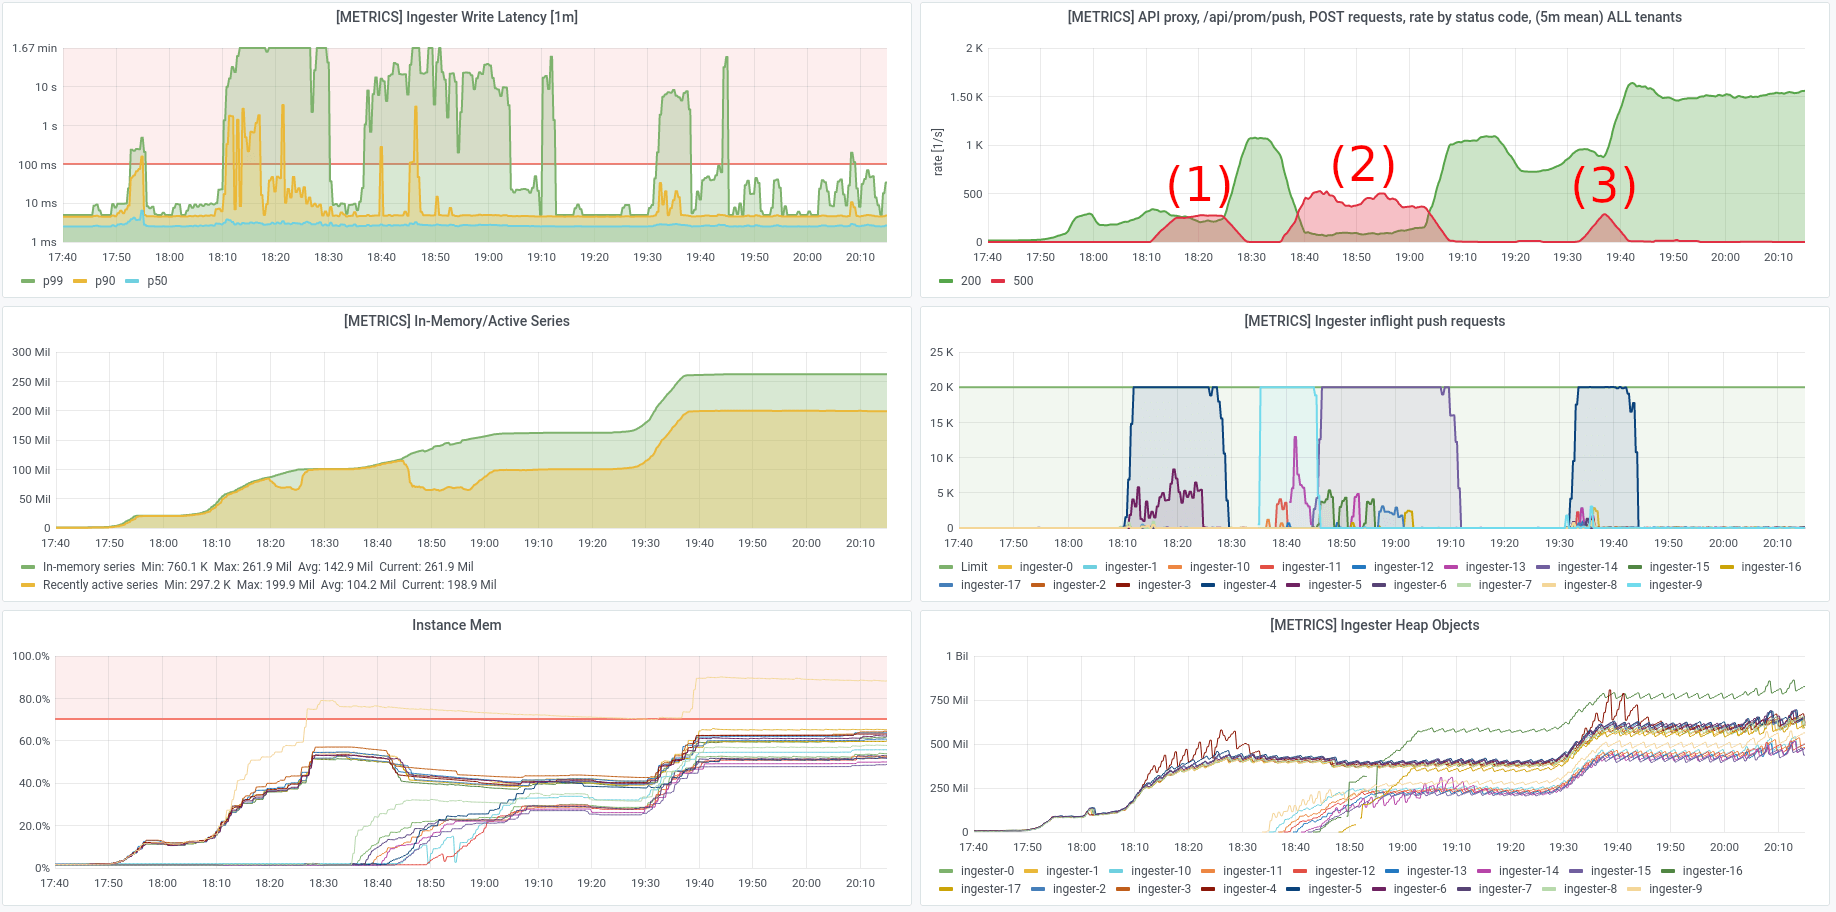
This provides some evidence that the number of ingesters has an effect on the rate that series can be processed. This was especially evident in the following charts from first bringing up the 18 node cluster, where it had started with 9 ingesters when going from 0 to 100M series, and then had 18 ingesters when going from 100M to 200M series. There are three intervals where 500 errors were being returned, which show as red humps in the upper right chart (see annotations):
- The first was for roughly 25 minutes when setting up the first 100M series against 9 ingesters.
- The second was for roughly 30 minutes when increasing the ingester count to 18 and shards were being redistributed.
- The third was for roughly 10 minutes when increasing the series count from 100M to 200M against 18 ingesters, and for a smaller proportion of all requests in that time.
Again, in practice, it is unlikely that 100M series would be introduced all at once like this, but we do see that things behave much better with a higher number of ingesters to spread the load.
This again indicates that write performance is related to the number of ingester instances.

We’ve seen that Cortex didn’t otherwise have any problems with the number of series, provided sufficient resources were available. But that’s the beauty with Opstrace. You get to pick the size of the instance, and that’s what you pay your cloud provider for, including any discounts you might have already negotiated.
When the Ingesters were OOMing, we also saw that the readiness check was effectively dependent on all other Ingesters in the ring being healthy, too. So, for example, a configuration change to ingester limits will not be completed until the ingesters are all healthy. This can result in a chicken-and-egg situation where ingester OOMs can block configuration fixes.
Findings
What we achieved
We ingested 200M distinct active metric series into a single tenant against two different Opstrace instance configurations for over a week. By the end we had:
- 200M series to a single tenant at a 60s sample rate with all values changing on each sample and all series labels changing daily
- Write latency was generally stable with 5ms for p99, but this could increase to several seconds p99 when many series are being added.
- Error rate was minimal with limits on inflight requests and increased ingester count
- Resource usage for 18 nodes cluster at 200M series (all series relabeled
daily).
- S3 data volume was 5.5TB (so far). However the test series values all change on a 30s period, which would reduce compressibilty of the data.
- CPU usage was around 60% with peaks around 80%
- RAM usage was around 2.5TB across all of the Opstrace instance, with the vast majority concentrated in the ingesters. We have not yet investigated reducing this usage.
- EBS Disk volume usage was around 1-2TB, with the vast majority again concentrated in the ingesters
- Network throughput was around 10GBit across all Opstrace nodes
Along the way, we found that assigning max_inflight_push_requests is necessary
to ensure ingester stability in the face of tens of millions of series being
created or relabeled.
Without this limit, initializing the series ends up creating a backlog in the ingesters that can cause them to OOM.
We were able to verify that things became stable once this configuration had been applied, and did not notice any issues outside of the ingesters, for example the compactors seemed to be healthy. Based on talking to users, we were expecting the compactors to be a significant bottleneck, but we did not find this to be the case in terms of compaction duration. This is an area that we would like to exercise further in future testing, since we know that compactor is sharding by tenants rather than time, it is an inevitable bottleneck.
Additionally, we found that the 18 r5.8xlarge cluster with 18 ingesters dealt with a bulk change in active series roughly twice as quickly as the 9 r5.16xlarge cluster with 9 ingesters, implying that there is a per-ingester or per-node bottleneck.
We have also been able to quantify the resources needed to run such a system, although further work is needed to optimize for cost.
In practice the main bottleneck was RAM, with the ingesters taking up the bulk of this. The nine r5.16xlarge cluster saw each of nine ingesters using 320-350GB, while the 18 r5.8xlarge cluster saw each of 18 ingesters using 170-190GB.
However we did not seek to tune the memory use of the ingesters, so there may be opportunity for less usage that we haven’t yet explored.
But overall, the main goal was to see how far we could go at larger scales of data, and set a baseline for further investigation and improvement—and we achieved that. We are very interested in comparing notes with anyone regarding Cortex scale tests you may have performed.
Future work
Restaing our goal from the introduction: we want to provide an easy-touse, configurable, yet safe open source observability distribution. Bounded configuration will set sane defaults at any scale you choose to use, and let you modify setting within those boundaries.
On this journey we have a lot of immediate tasks to iterate on, for example:
- This was testing without regard for resources (those 8xl instances add up quickly); we plan to do another iteration explicitly optimizing for resource consumption (i.e. using fewer resources) by tuning the various knobs in Cortex and the infrastructure.Observe the same load spread across multiple tenants.
- Introduce read loads (important and difficult).
- Alternate topologies, placing different components on different hardware for different purposes.
- Improve write workload generation with various options:
- Roll out Avalanche with some jitter, or delay between pods.
- Rather than using Prometheus instances to
remote_writedata into Opstrace, instead pair a Grafana Agent sidecar with each of the Avalanche instances. - Use the Opstrace Looker tool.
- Use the Cortex benchtool.
- Test with other cloud vendors—we just tested AWS with S3 for storage, but we also suppot GCP and will perform this test there.
Conclusion
We have seen how Opstrace behaves under heavy load when resources are not a bottleneck, and made fixes to our configuration and practices along the way. Benchmarks and stress tests are ultimately just exercising the scenario under test, and this might not align with the real world. Similarly, dimensionality may be worse or better (or just different) than what we tried so far.
We can now expand on this experience by seeing how we can optimize costs while retaining good performance under very large workloads. Additionally, this will allow us to auto-configure Opstrace with reasonable tuning and boundary configurations for various load patterns.
We’ve published our configurations into a public repo that you can see today and will be pushing updates there as we test and improve Opstrace. If you have recently encountered scaling issues with Cortex, let us know and we can exchange notes.
[1] The screenshots shown here are from our default “Opstrace System Overview” dashboard. The panels are (left column then right column, top to bottom):
- “Ingester Write Latency”: How long it’s taking for the ingester to write things. Goes up when new series are being initialized.
- “In-Memory/Active Series”: The number of series that are being stored in memory, and how many series are considered “active” or recently updated.
- “Instance Mem”: The amount of overall system memory that’s being used by the nodes in the Opstrace instance.
- “API proxy, /api/prom/push POST requests”: The rate requests sending metrics to the Opstrace instance, grouped by their responses.
- “Ingester Inflight Push Requests”: The number of requests that each ingester instance has pending. As this increases, so does ingester memory usage.
- “Ingester Heap Objects”: The number of objects on the process heap, a measure of memory usage and garbage collection in the ingesters.
[2] Opstrace currrently provides a uniform limit on the number of series that you can send to it, regardless of the size of instance provisioned. In the future our goal is to auto-configure these limits based on the size of instance being provisioned.