Direction
Updates on Opstrace Integration into GitLab
Updates on Opstrace Integration into GitLab
Read announcement
Article
Opstrace is joining GitLab!
Read more
Article
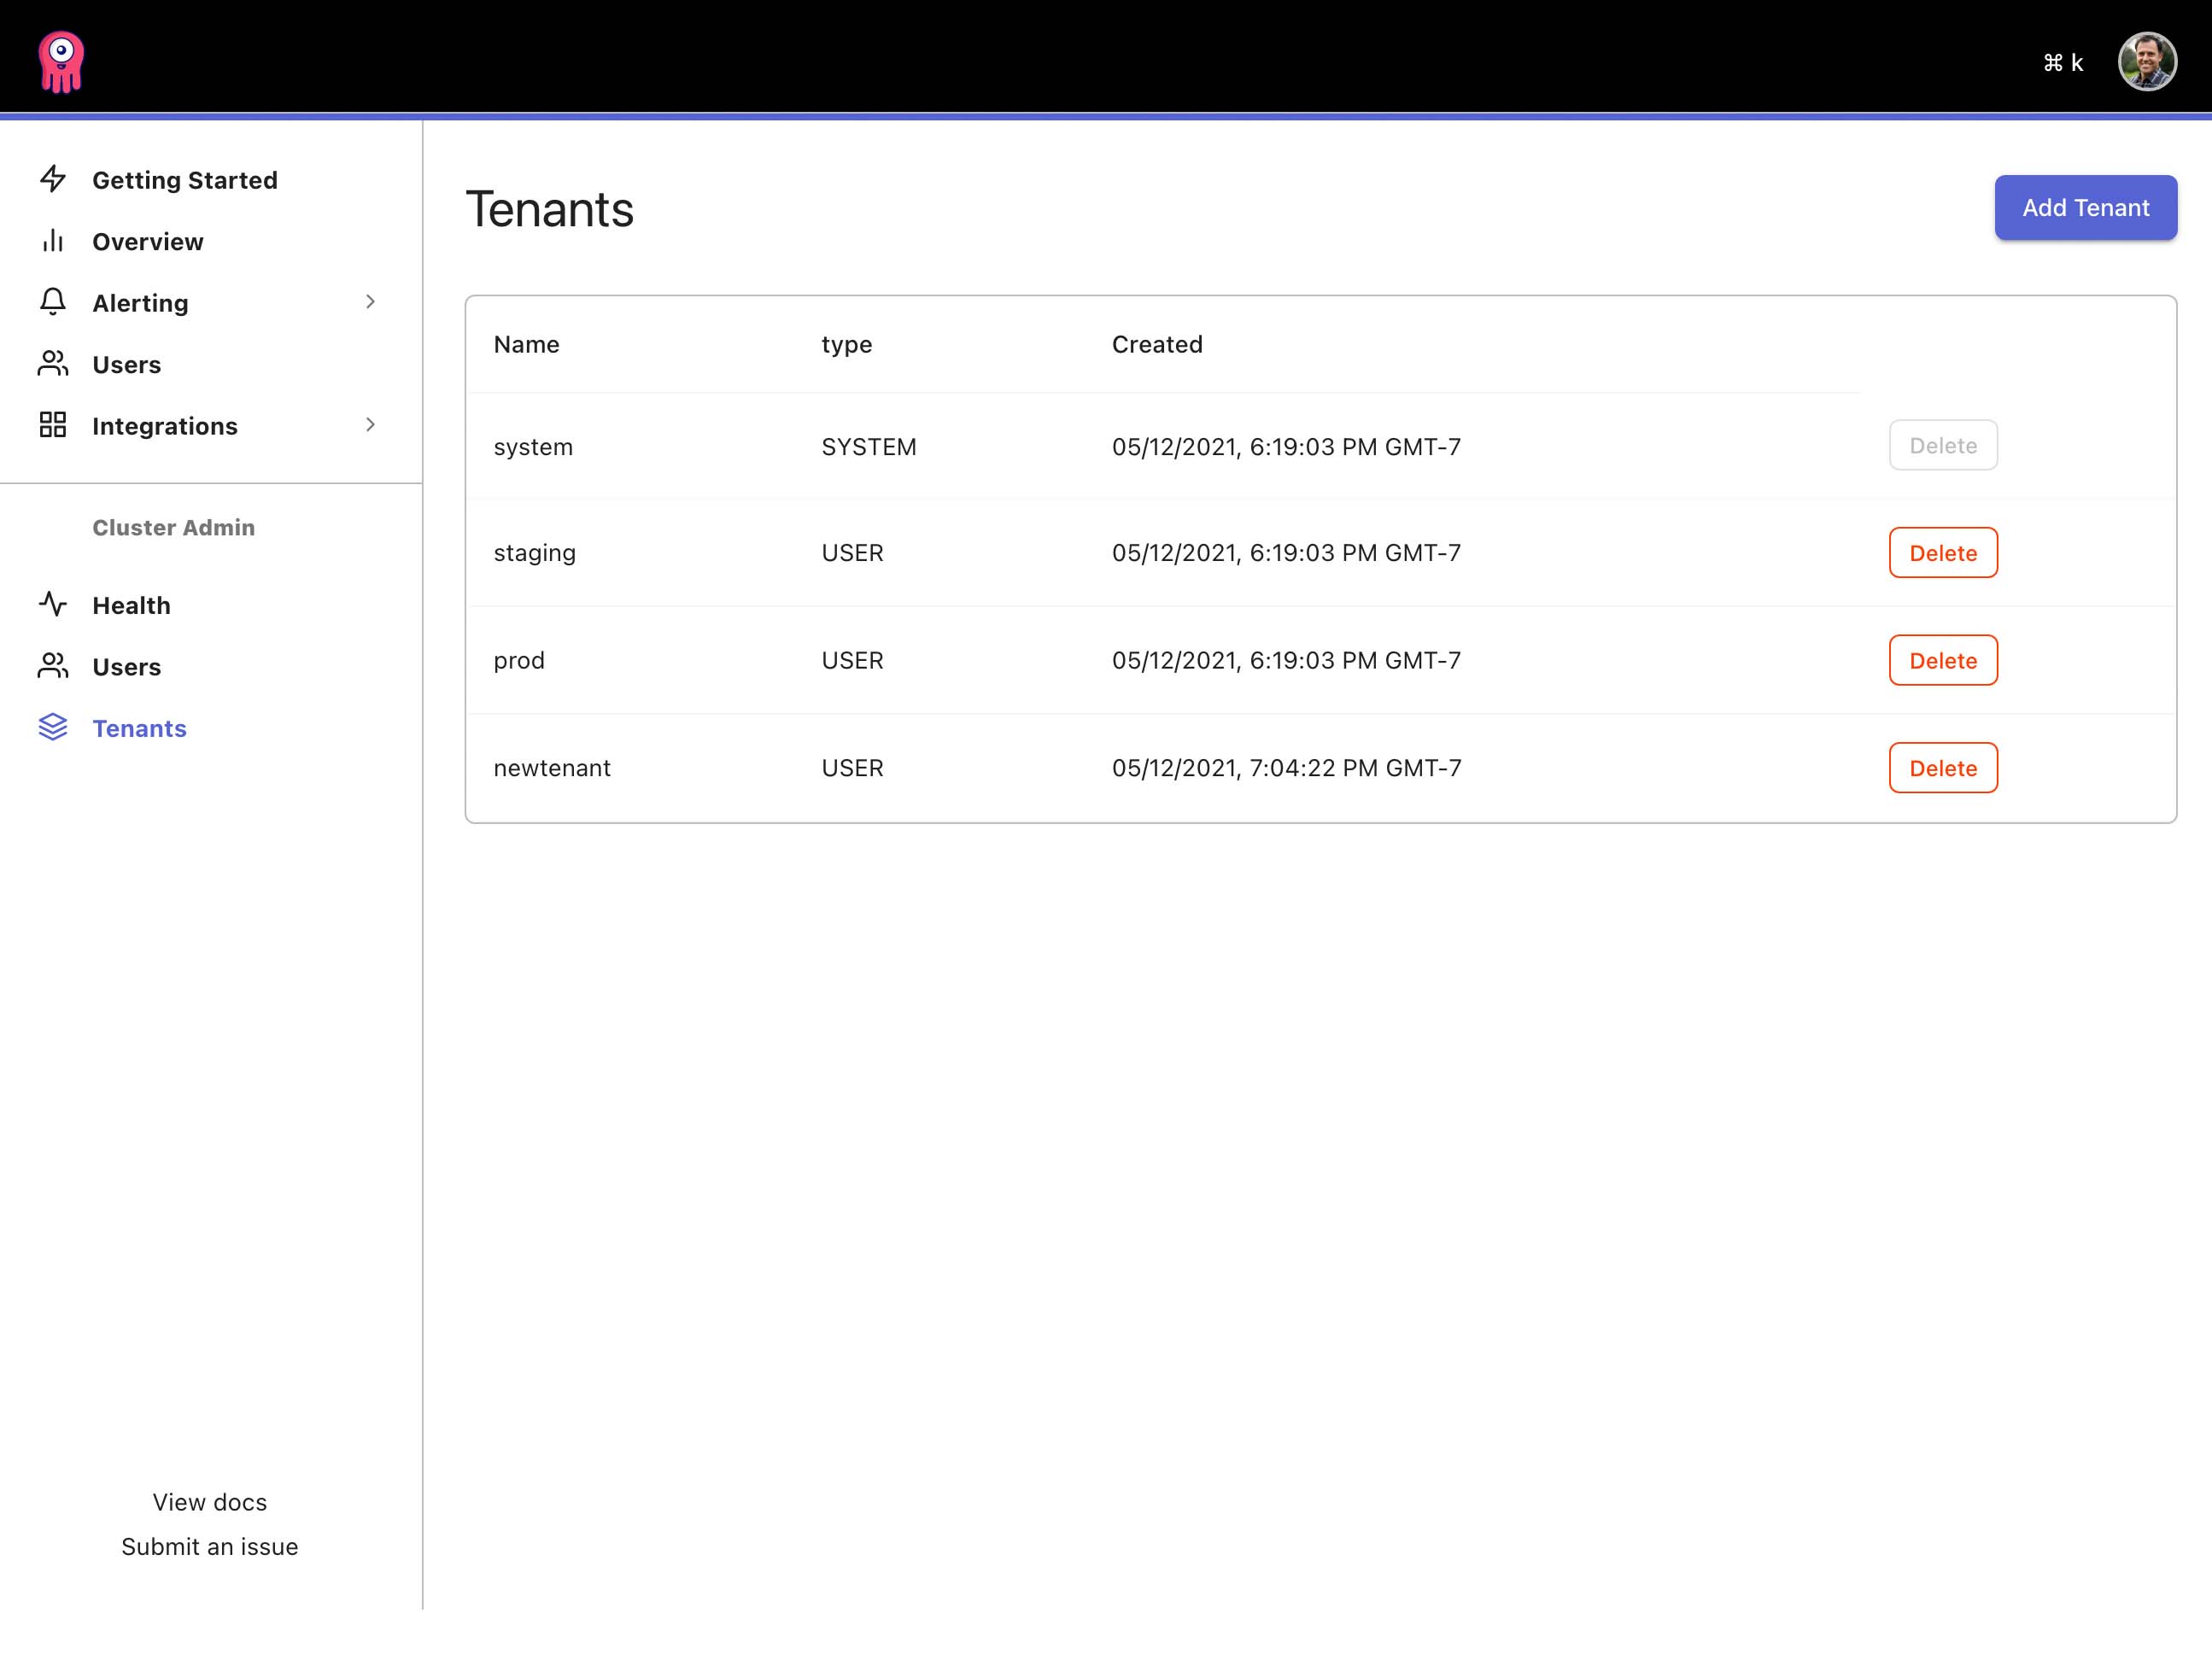
What is Multi-tenancy?
Read more
Article
Update #8
Read more
Article
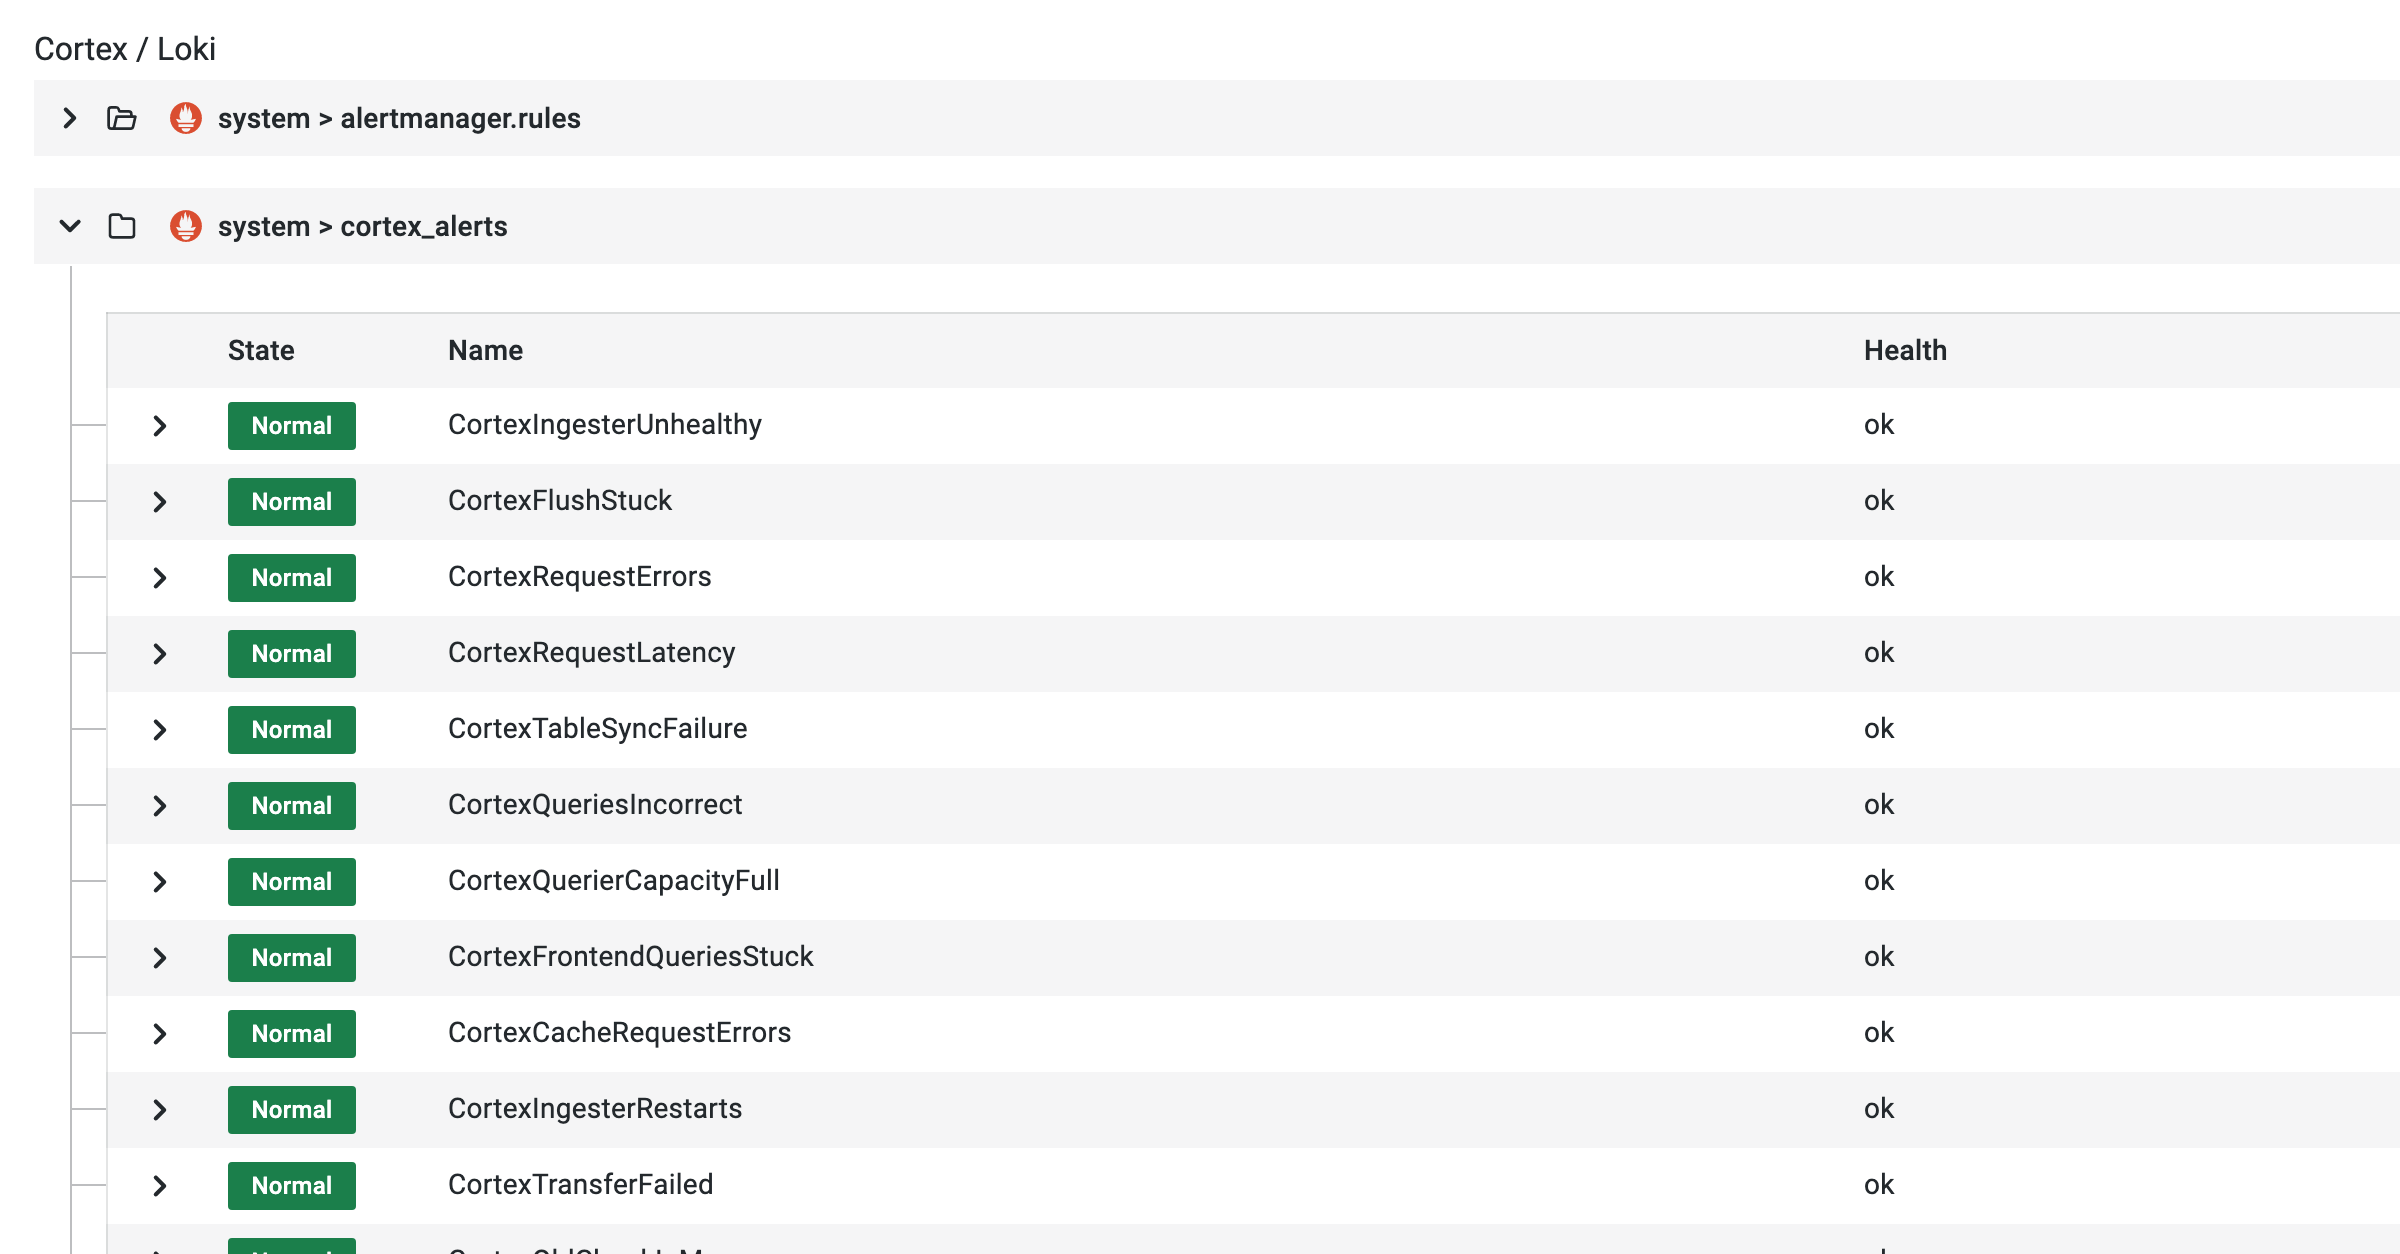
A Giant Leap for Alert Management
Read more
Article
Product Docs Alongside Product Code (with Next.js)
Read more
Article
Update #7
Read more
Article
Cloud Provider Integrations
Read more
Article
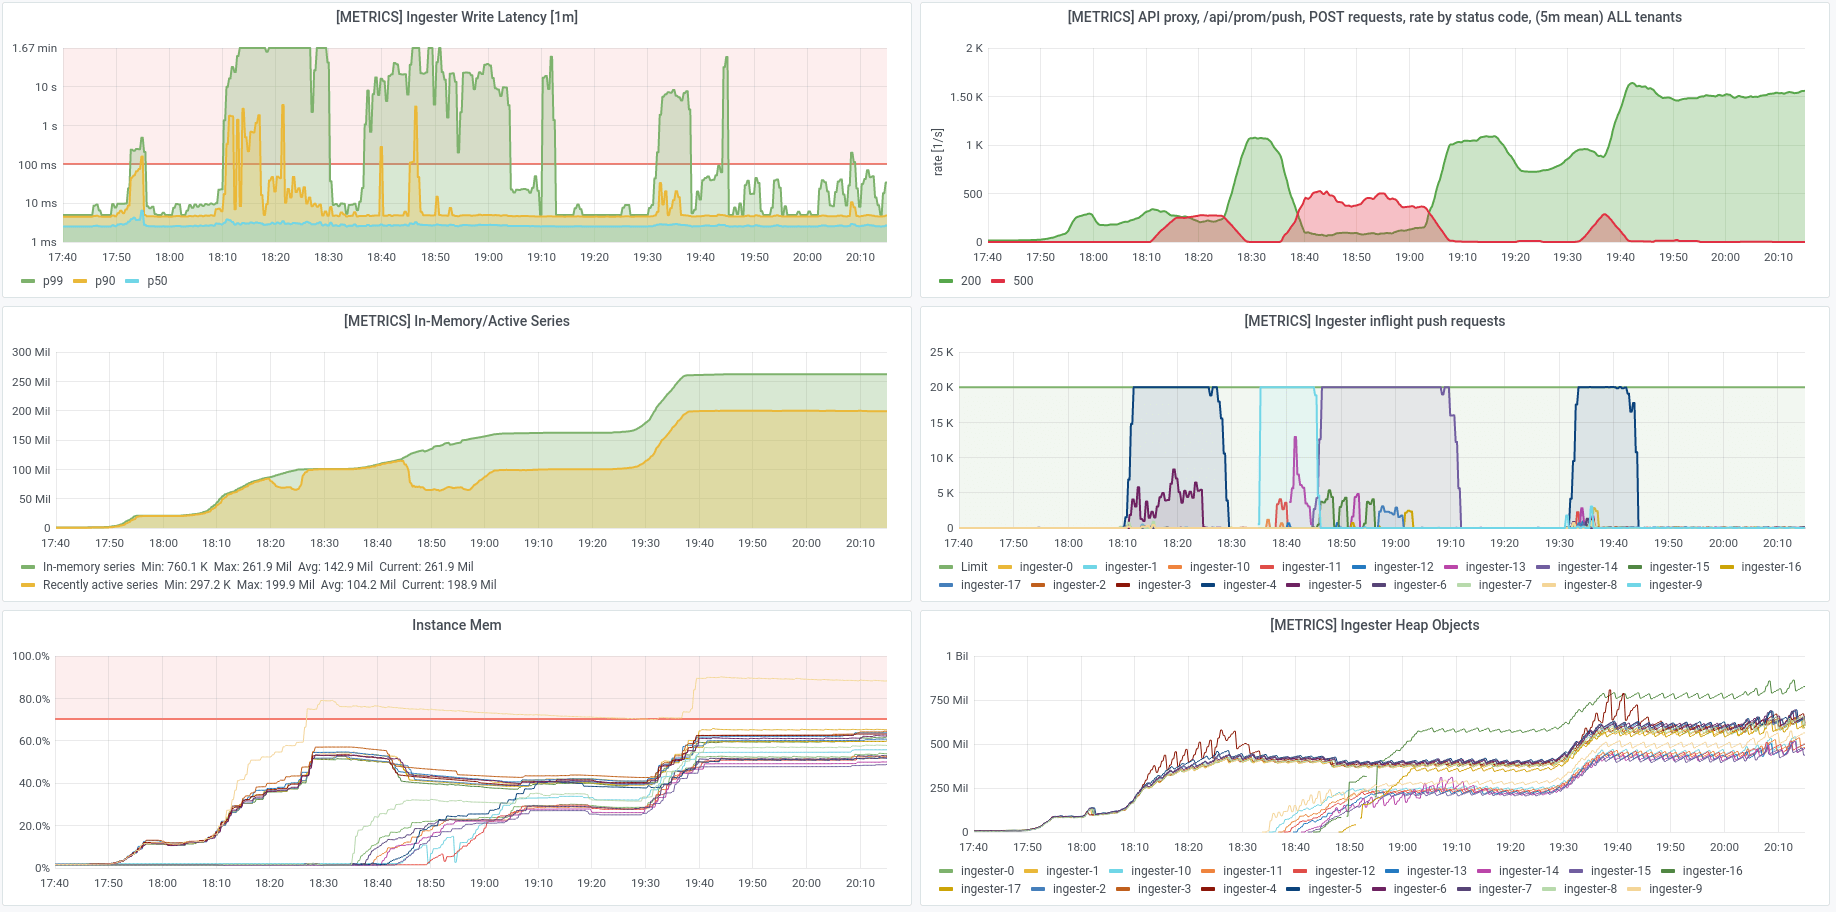
Scale Testing Cortex Writes with 200M Active Series
Read more
Article
Update #6
Read more
Article
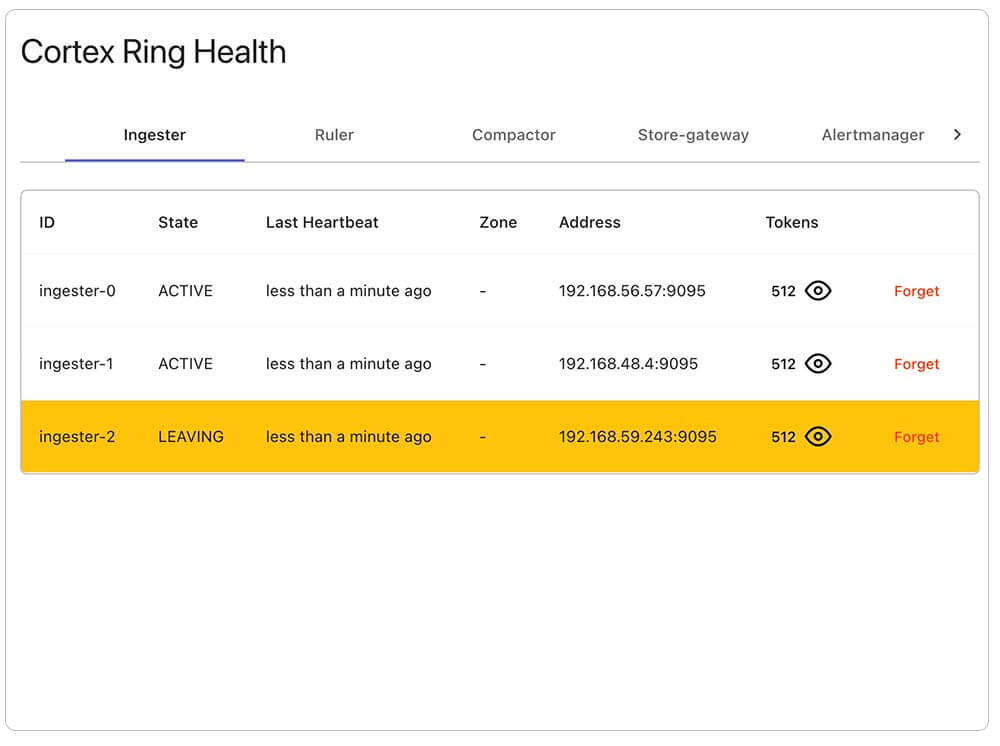
Introducing the Ring Health UI for Cortex and Loki Components
Read more
Article
Dynamic per-tenant Cortex limits, configurable via UI
Read more
Article
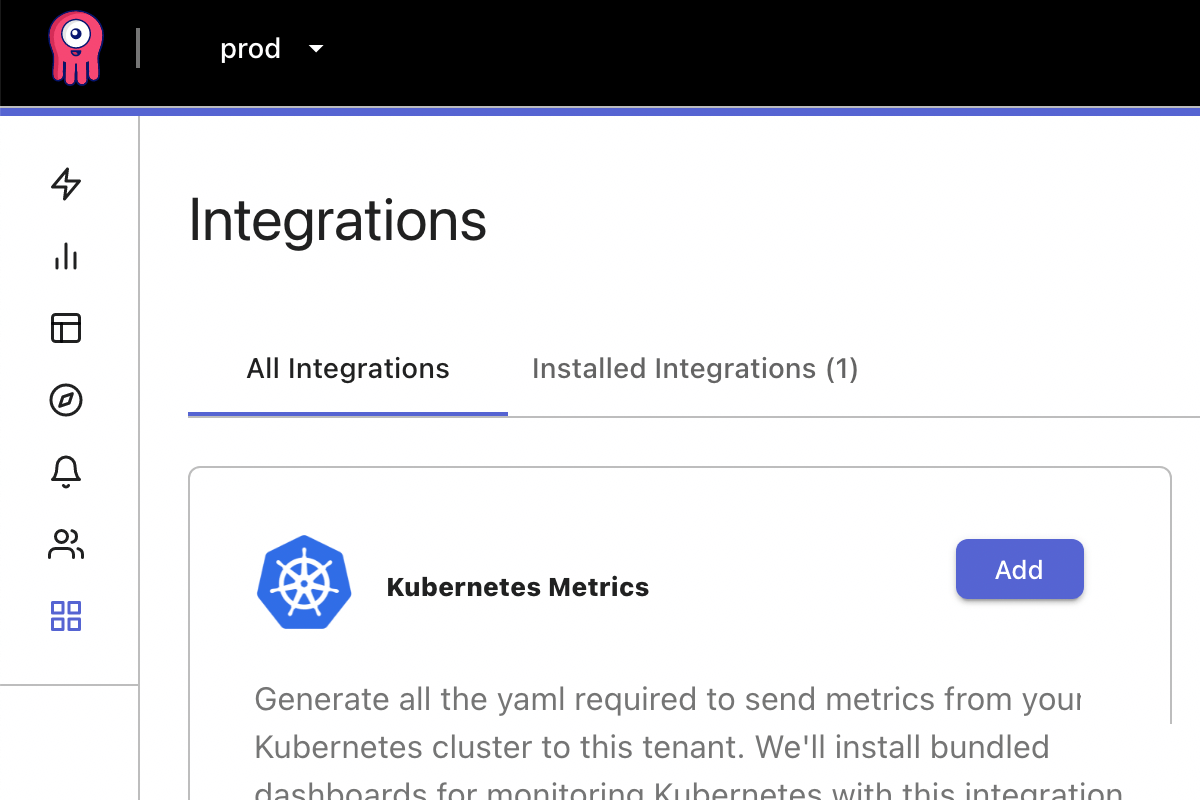
Open Source Kubernetes Collection in Less Than One Minute
Read more
Article
Introducing an Operator for Cortex
Read more
Article
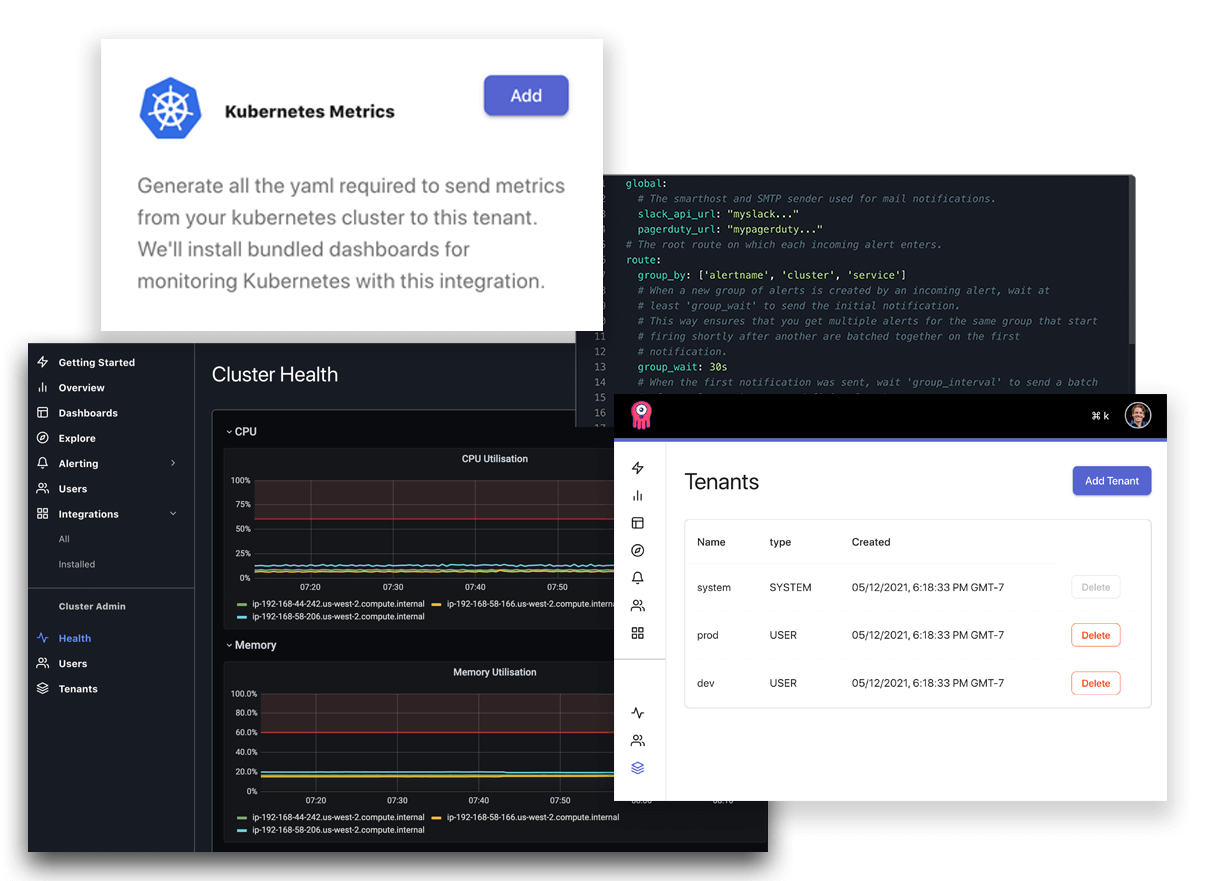
A New UI to Improve Observability UX
Read more
Article
Introducing dynamic tenant creation
Read more
Article
Update #5
Read more
Article
Toward High-trust, Zero-downtime Upgrades
Read more
Article
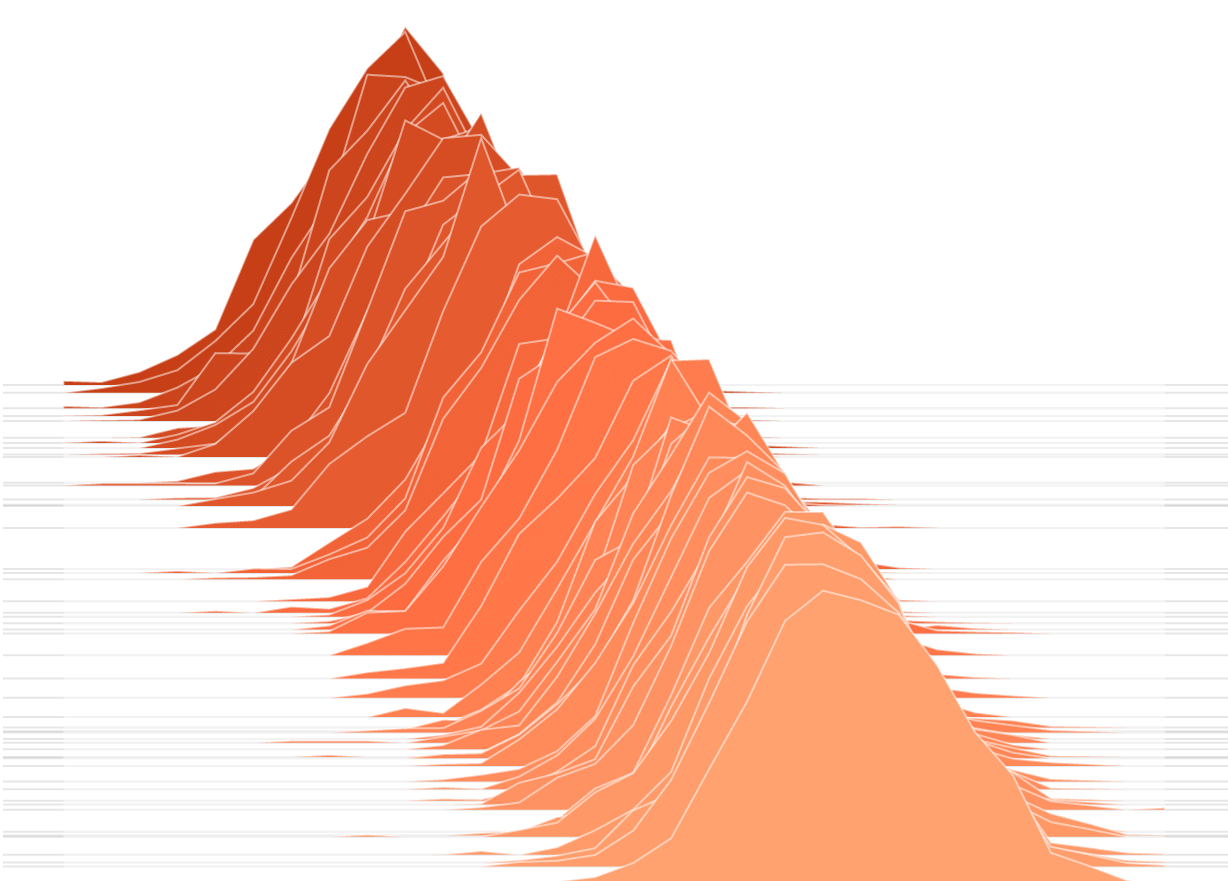
Histogram evolution: visualize how a distribution of values changes over time
Read more
Article
Update #4
Read more
Article
Opstrace: The Open Source Observability Distribution
Read more
Article
Update #3
Read more
Article
Configuring Scalable Alertmanager
Read more
Article
Update #2
Read more
Article
Why we chose Cortex and Loki
Read more
Article
Update #1
Read more
Article
Collecting Cloud Provider Metrics with Opstrace
Read more
Article
Introducing a Datadog-compatible HTTP API
Read more
Article
Pulling back the curtain on monitoring cost
Read more
Article
Opstrace Public Launch!
Read more