


Jun 17 | 4 min read
Cloud Provider Integrations
Nahum Wild

Collect metrics from your cloud provider services into Opstrace with new integrations
We briefly introduced Opstrace Integrations last month as part of our UI refresh announcement. To recap, in case you missed it: Opstrace Integrations in Opstrace make collecting data and visualizing it as simple as clicking a button. The initial release included two integrations focused on monitoring your Kubernetes clusters, but our ultimate goal is to build a rich catalog of integrations for all the services or applications you may use.
Introducing new Opstrace Integrations for Monitoring Cloud Hosted Services
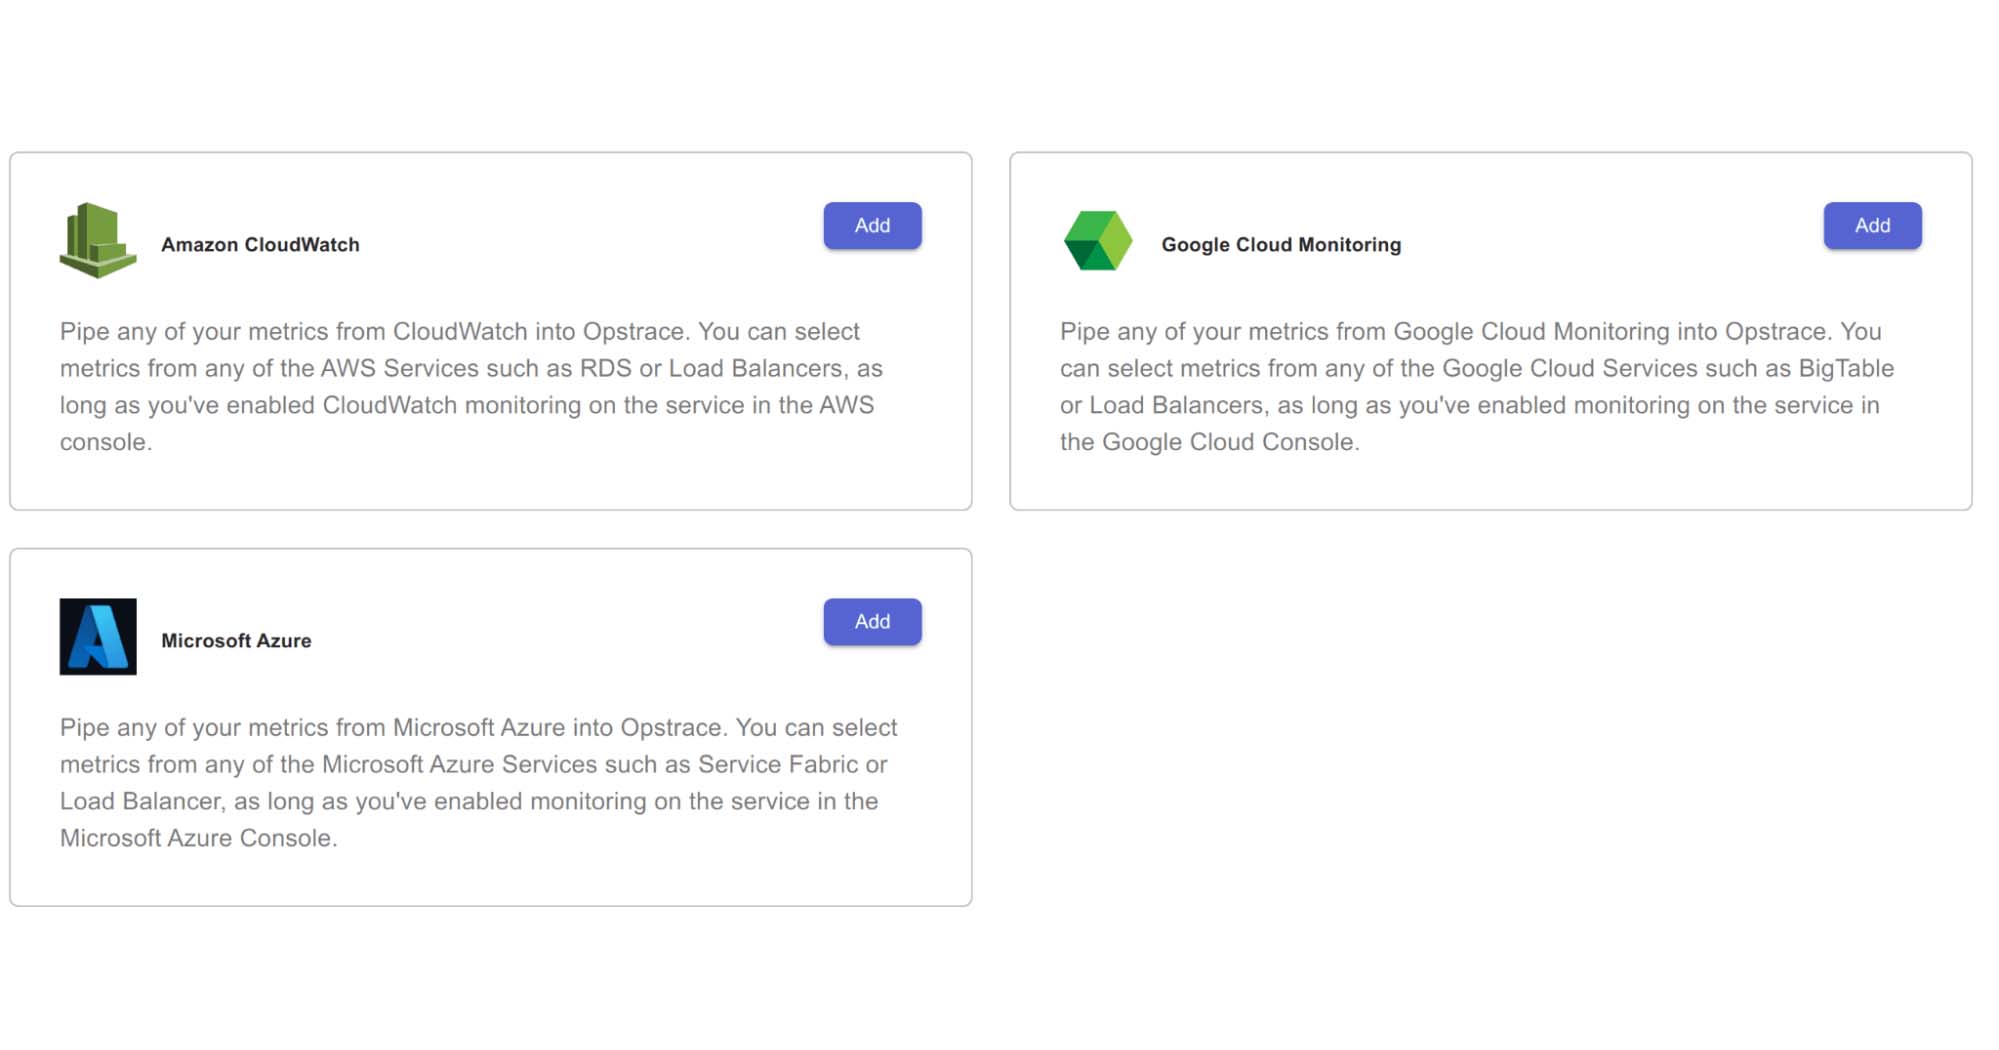
Three new Opstrace Integrations focus on collecting data from the big three Cloud Hosting services—Amazon Web Services, Google Cloud Platform, and Microsoft Azure. Your services produce a lot of metrics, and so do the services that you consume from your cloud provider. These new integrations (formerly known as “exporters") collect those metrics from your provider and ingest them into Opstrace.

What can you do with these? Let’s say you’re collecting your own application metrics into some monitoring system. You have dashboards and alerts setup so you understand how your application behaves. But do you have all of the data you need? Many people either ignore cloud provider metrics or interact with them via a separate set of tools. For example, AWS CloudWatch has default dashboards for many services but this is not ideal unless you’re using CloudWatch for all of your monitoring. Instead, exporting those metrics from AWS into your monitoring system with all of your other metrics allows you to form queries and alerts based on both, at the same time, in the same way. In the example below, we will show you how to collect the ELB request count metric from AWS.
Under the hood these new cloud provider integrations launch and manage a
Kubernetes pod inside your Opstrace instance running with one of the
open
source
exporters that are
maintained by the community. As with all of Opstrace, the opstrace upgrade
command will upgrade the exporters for you in the background whenever there are
changes, so you’re always kept up-to-date.
Getting Started with an Example
To install an integration, you need to know what metrics you want to monitor and the credentials (with the appropriate permissions) to access them. For example, below we demonstrate configuring the CloudWatch integration to collect AWS ELB NewFlowCount:

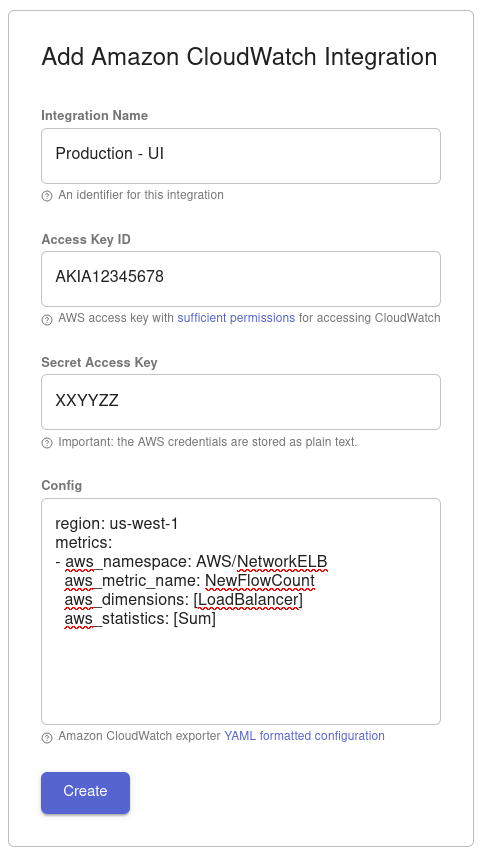
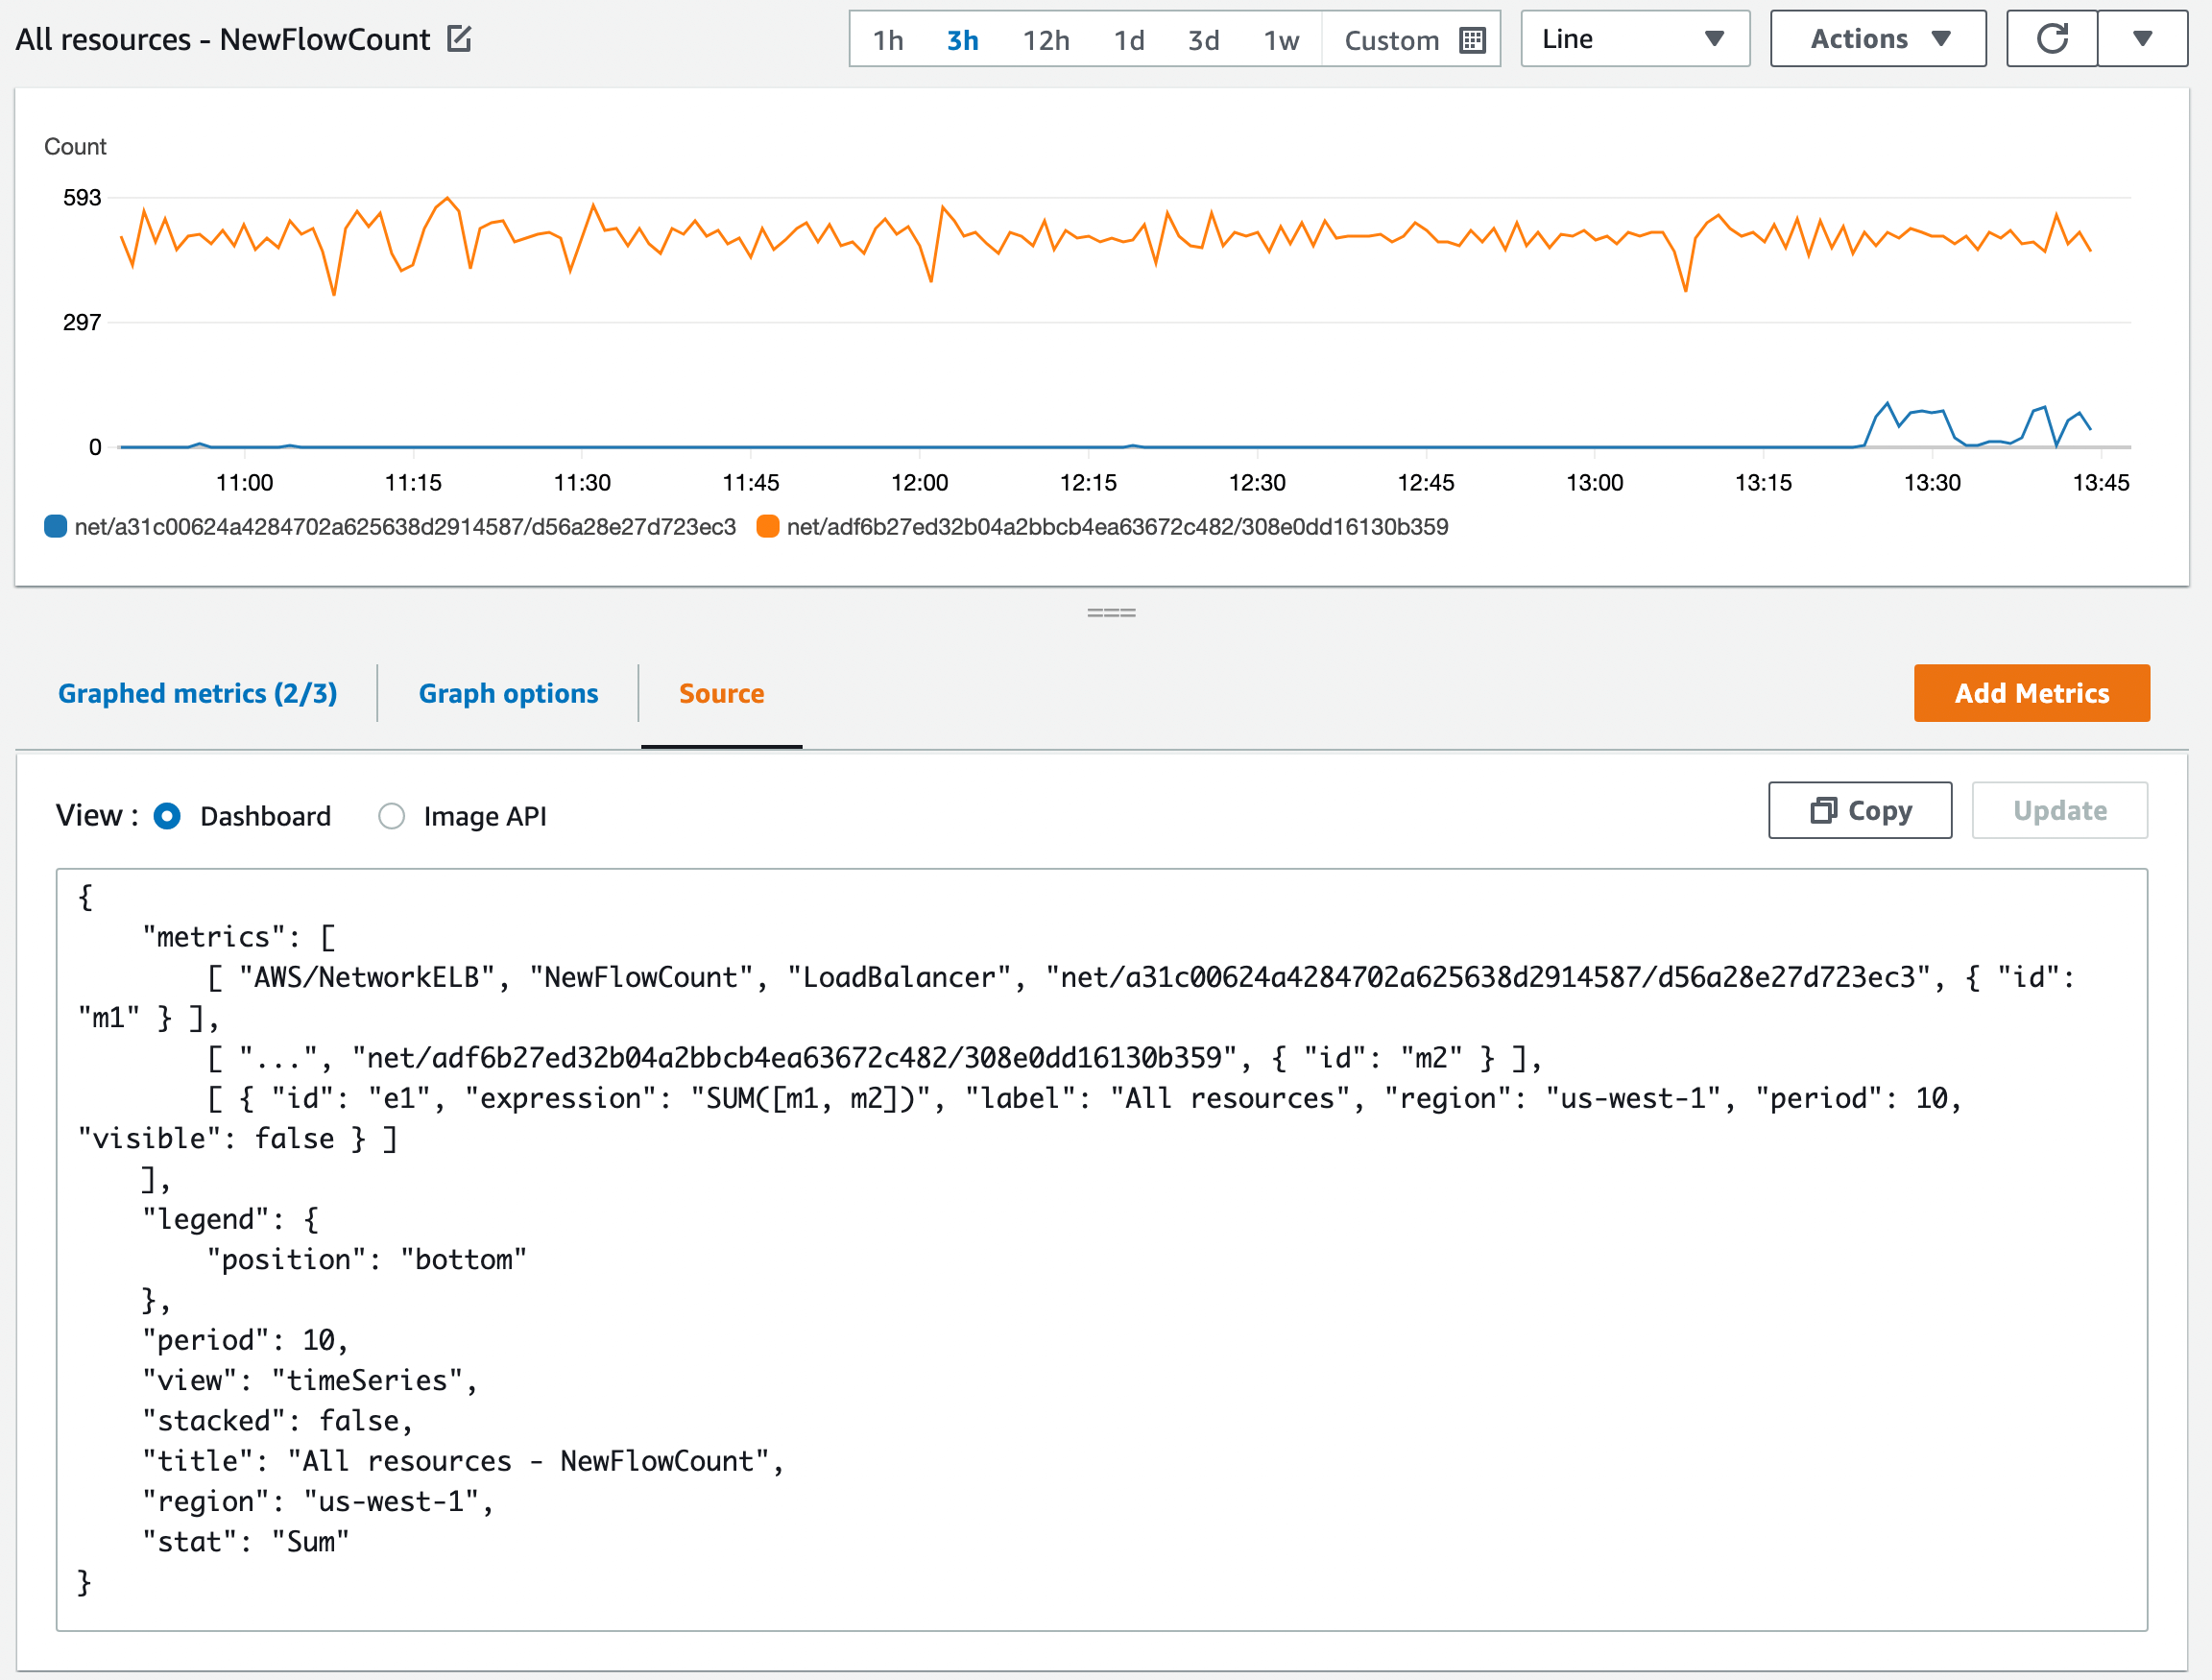
This configuration will pull in the NewFlowCount metric that describes the number of new connections created from clients in a time window. This can be graphed with CloudWatch, as seen below.

After clicking create, you will be taken to the status page for this installed integration. You will need to wait until the status is displayed as active (in the upper right-hand corner):

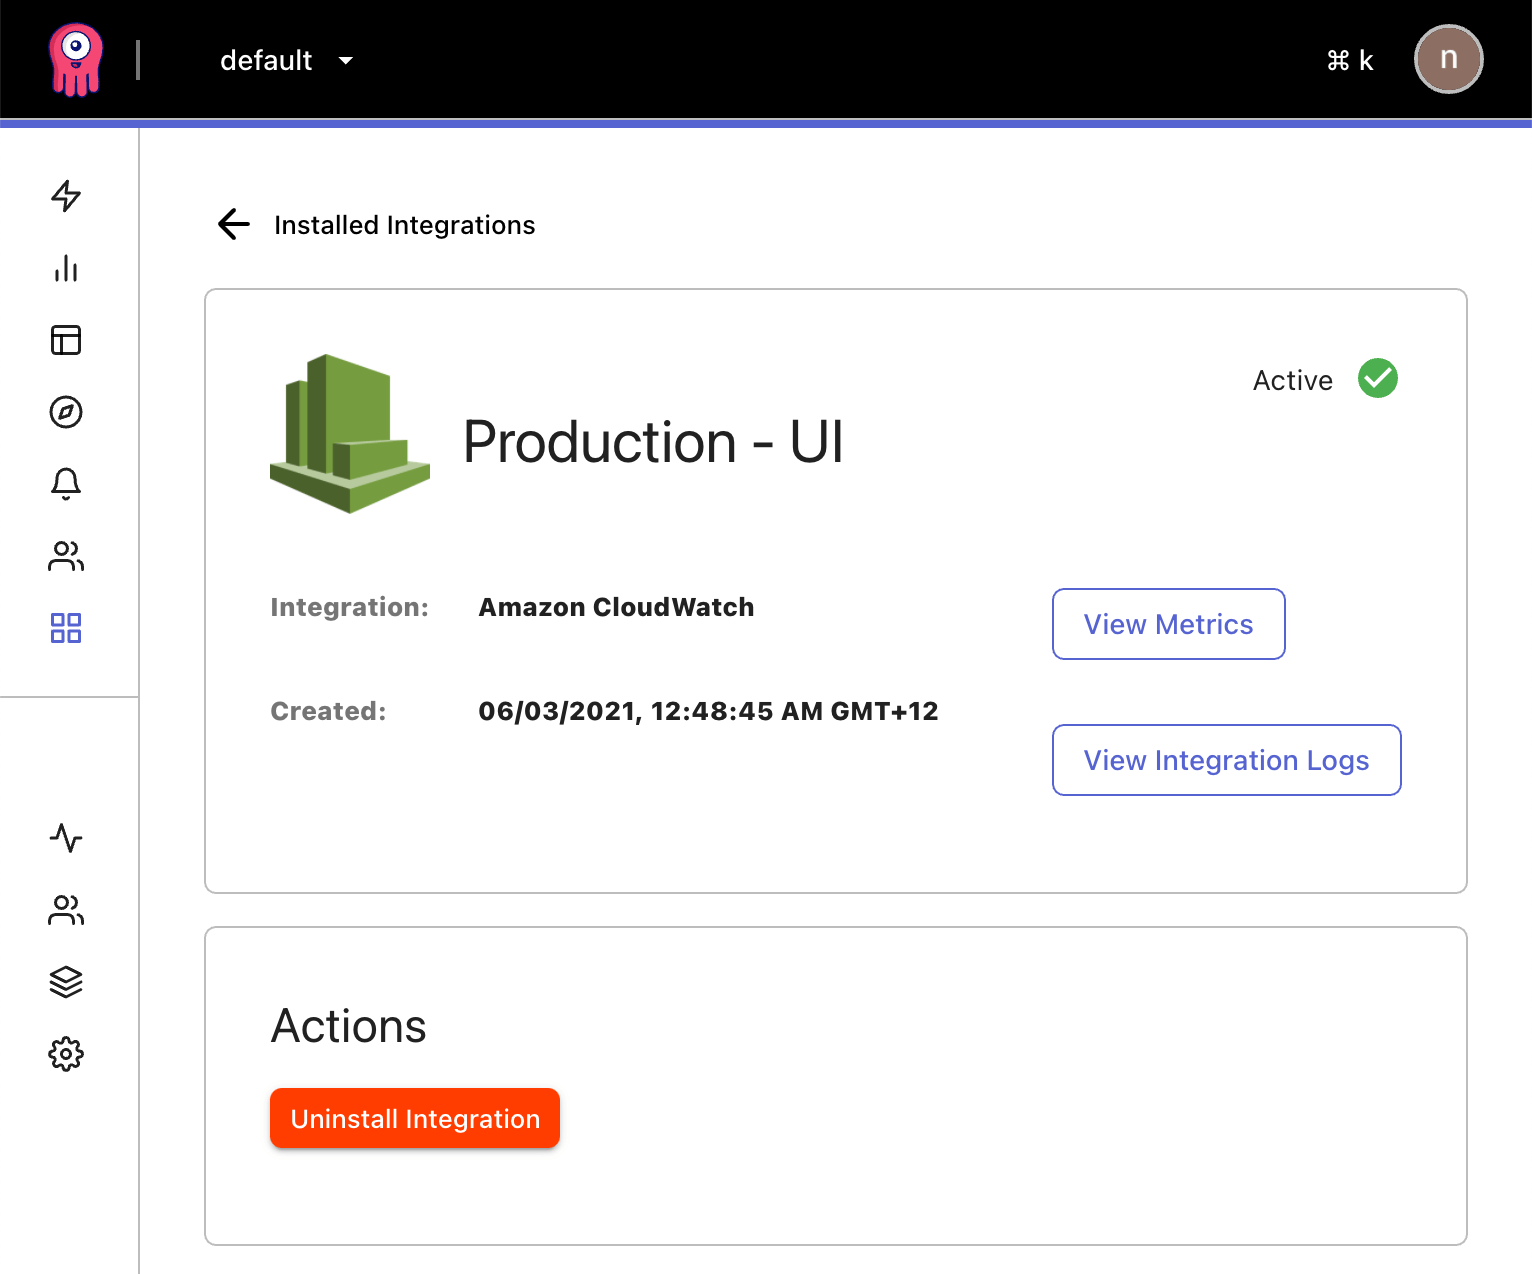
The "active" status means everything is up and running and metrics flowing in. More importantly this means the credentials you specified are valid and have the appropriate access permissions for the metrics you wanted. We find this is the point that trips most folks up. If the status is "error," use the "View Integration Logs" button to see what the underlying exporter is having trouble with.
Once the integration is active, the "View Metrics" button will take you straight to a pre-filled query that show the metrics collected from your cloud provider.

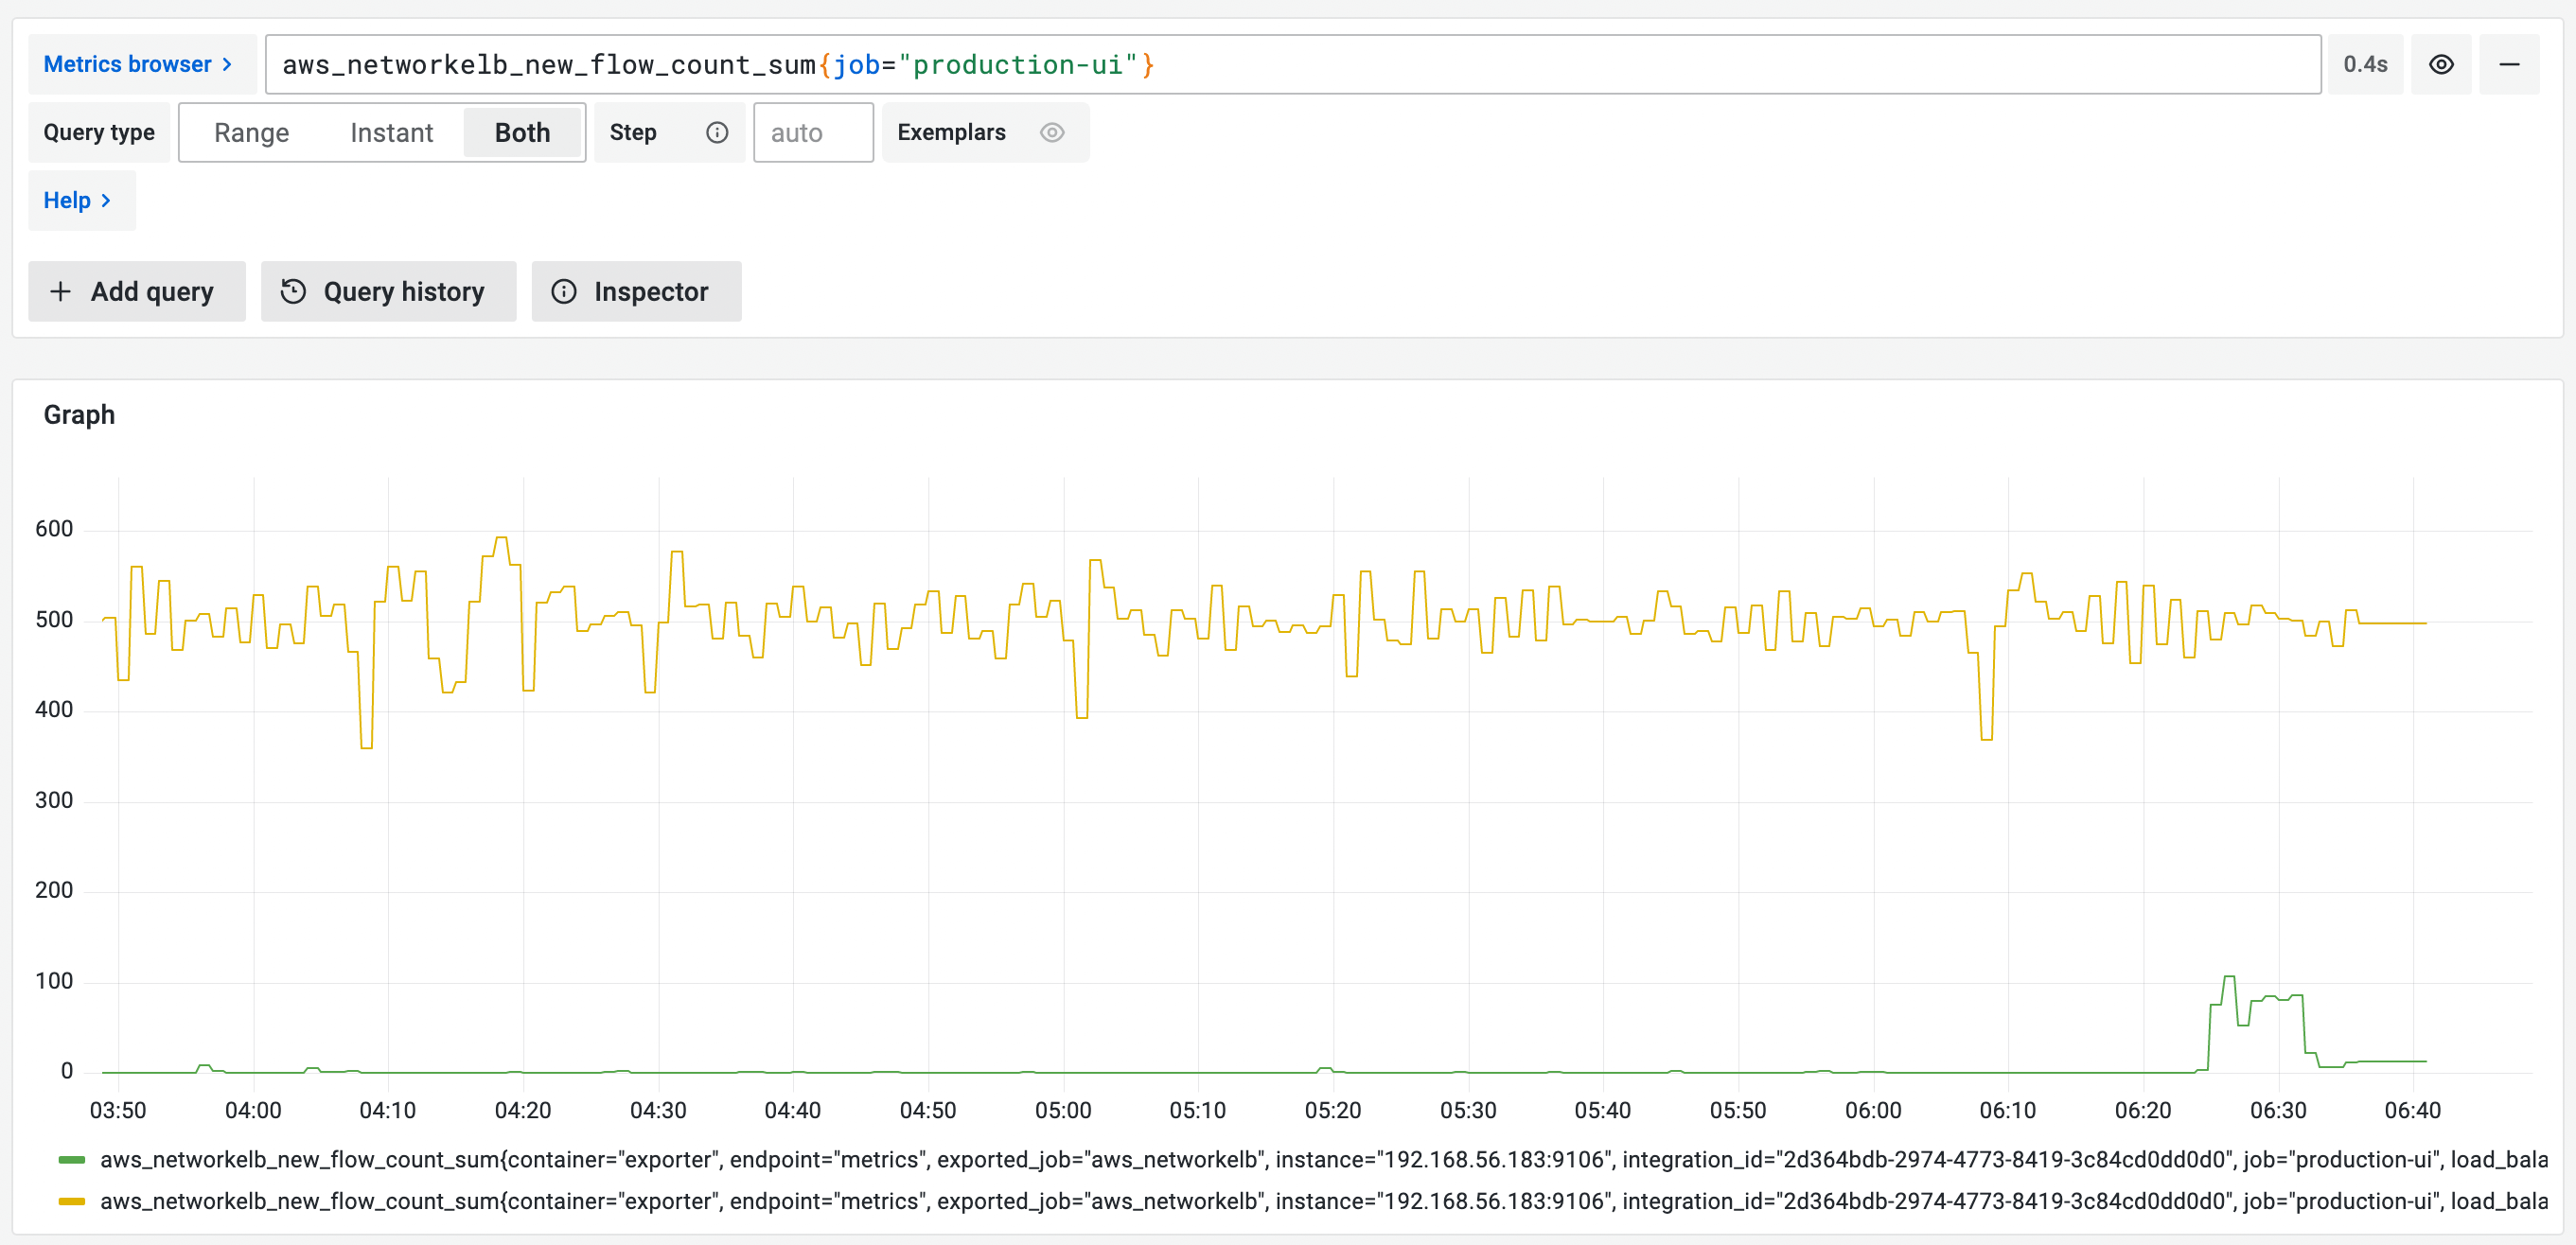
(Note: CloudWatch metrics may appear "bumpy" in dashboards. This is a side effect of CloudWatch only collecting most metrics on a 60s interval.)
Once metrics begin flowing in you can begin to leverage them by creating dashboards and setting up Alerts.
It's as simple as that.
The integrations for the other cloud hosting providers are similar, although you will need to use slightly different formats for each. The UI has helpful links to that documentation for reference.
Which other services are you most interested in integrating with? Let us know!