


May 13 | 6 min read
A New UI to Improve Observability UX
Tons of new UI features reduce major operational and exploration pain points that exist in open source observability today
We're excited to announce our new UI for the Opstrace open source observability distribution!
Our goal at Opstrace is not only to streamline the installation and management of open source observability infrastructure, but to also improve its usability. We want to knock down barriers to management, discovery, and exploration for engineers and end-users alike. So, we've targeted common pain points across these areas in our new UI. Painpoints that have previously been underserved—or simply ignored.
Let's jump into what we've cooked up and talk about what's coming next.
Transparency and Control
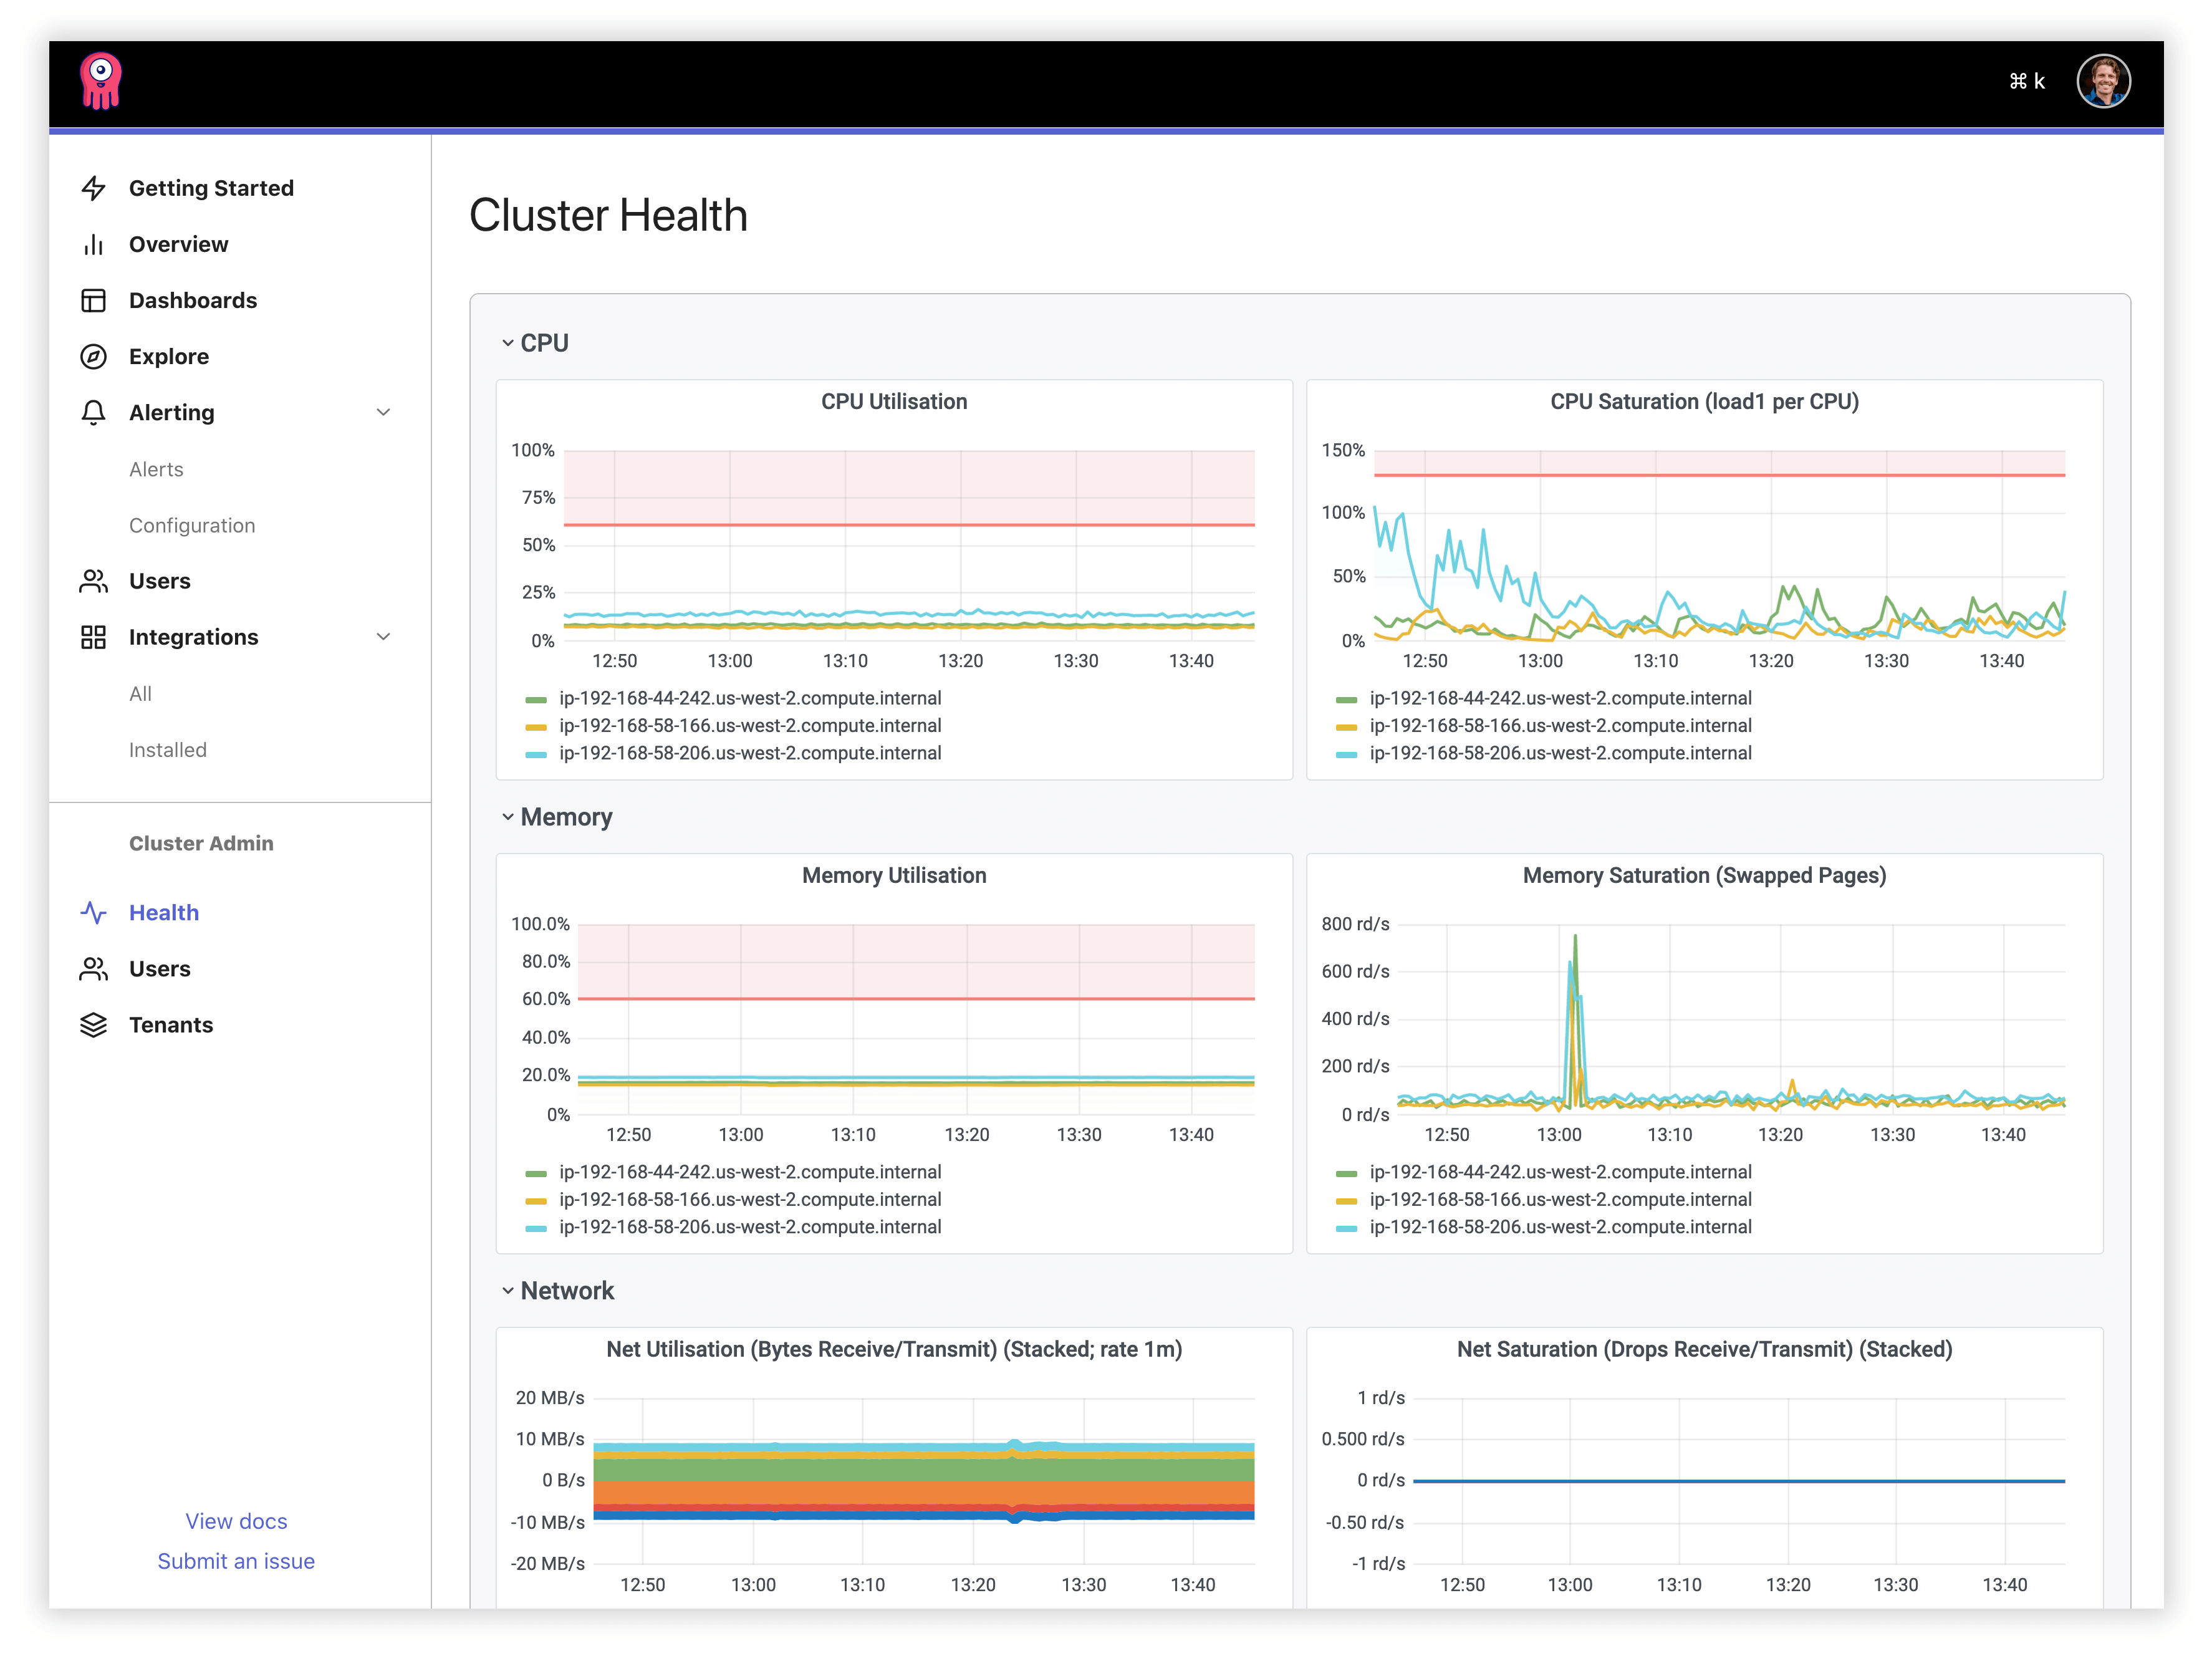
Opstrace is rooted in a belief that through automation, we can provide a system that reliably handles scaling, upgrading, and recovery from known faults to reduce user toil. While automation is important, we also believe that control must still lie with the operator who must make choices that Opstrace shouldn't make, for example, when to add another node to the cluster if resources are exhausted. Today, the operator has all the tools to monitor the cluster and manually intervene at his or her disposal. Our new cluster health dashboard brings this front and center in the UI, with key metrics that correlate with the overall system health.
In the future, we'll improve this scenario by sending a specific notification to the operator and then empower them with full visibility into the system so they can decide to click the "automatic scale-up" button, or for example, identify that their dev team has accidentally enabled verbose logging in one of their apps, and the correct course of action is to fix the application's log level (and possibly adjust their rate limits).

A Unifying Experience
If you've spent much time with existing open source observability tools, you're probably aware of their shortcomings as well as their benefits. One major shortcoming is a disjoint, inefficient user experience. One that we aim to unify.
Under the hood, we rely on Cortex, Loki, and Alertmanager as major system components. Today, when you stitch these together for yourself, they feel like a mishmash—the Prometheus UI, Alertmanager UI, Grafana UI, and probably some scripts that call APIs. Alternatively, you could give up on open source observability and use an external vendor like Grafana cloud or Datadog. To begin unifying this disparate user experience, we've begun to centralize all of these components into the Opstrace UI.
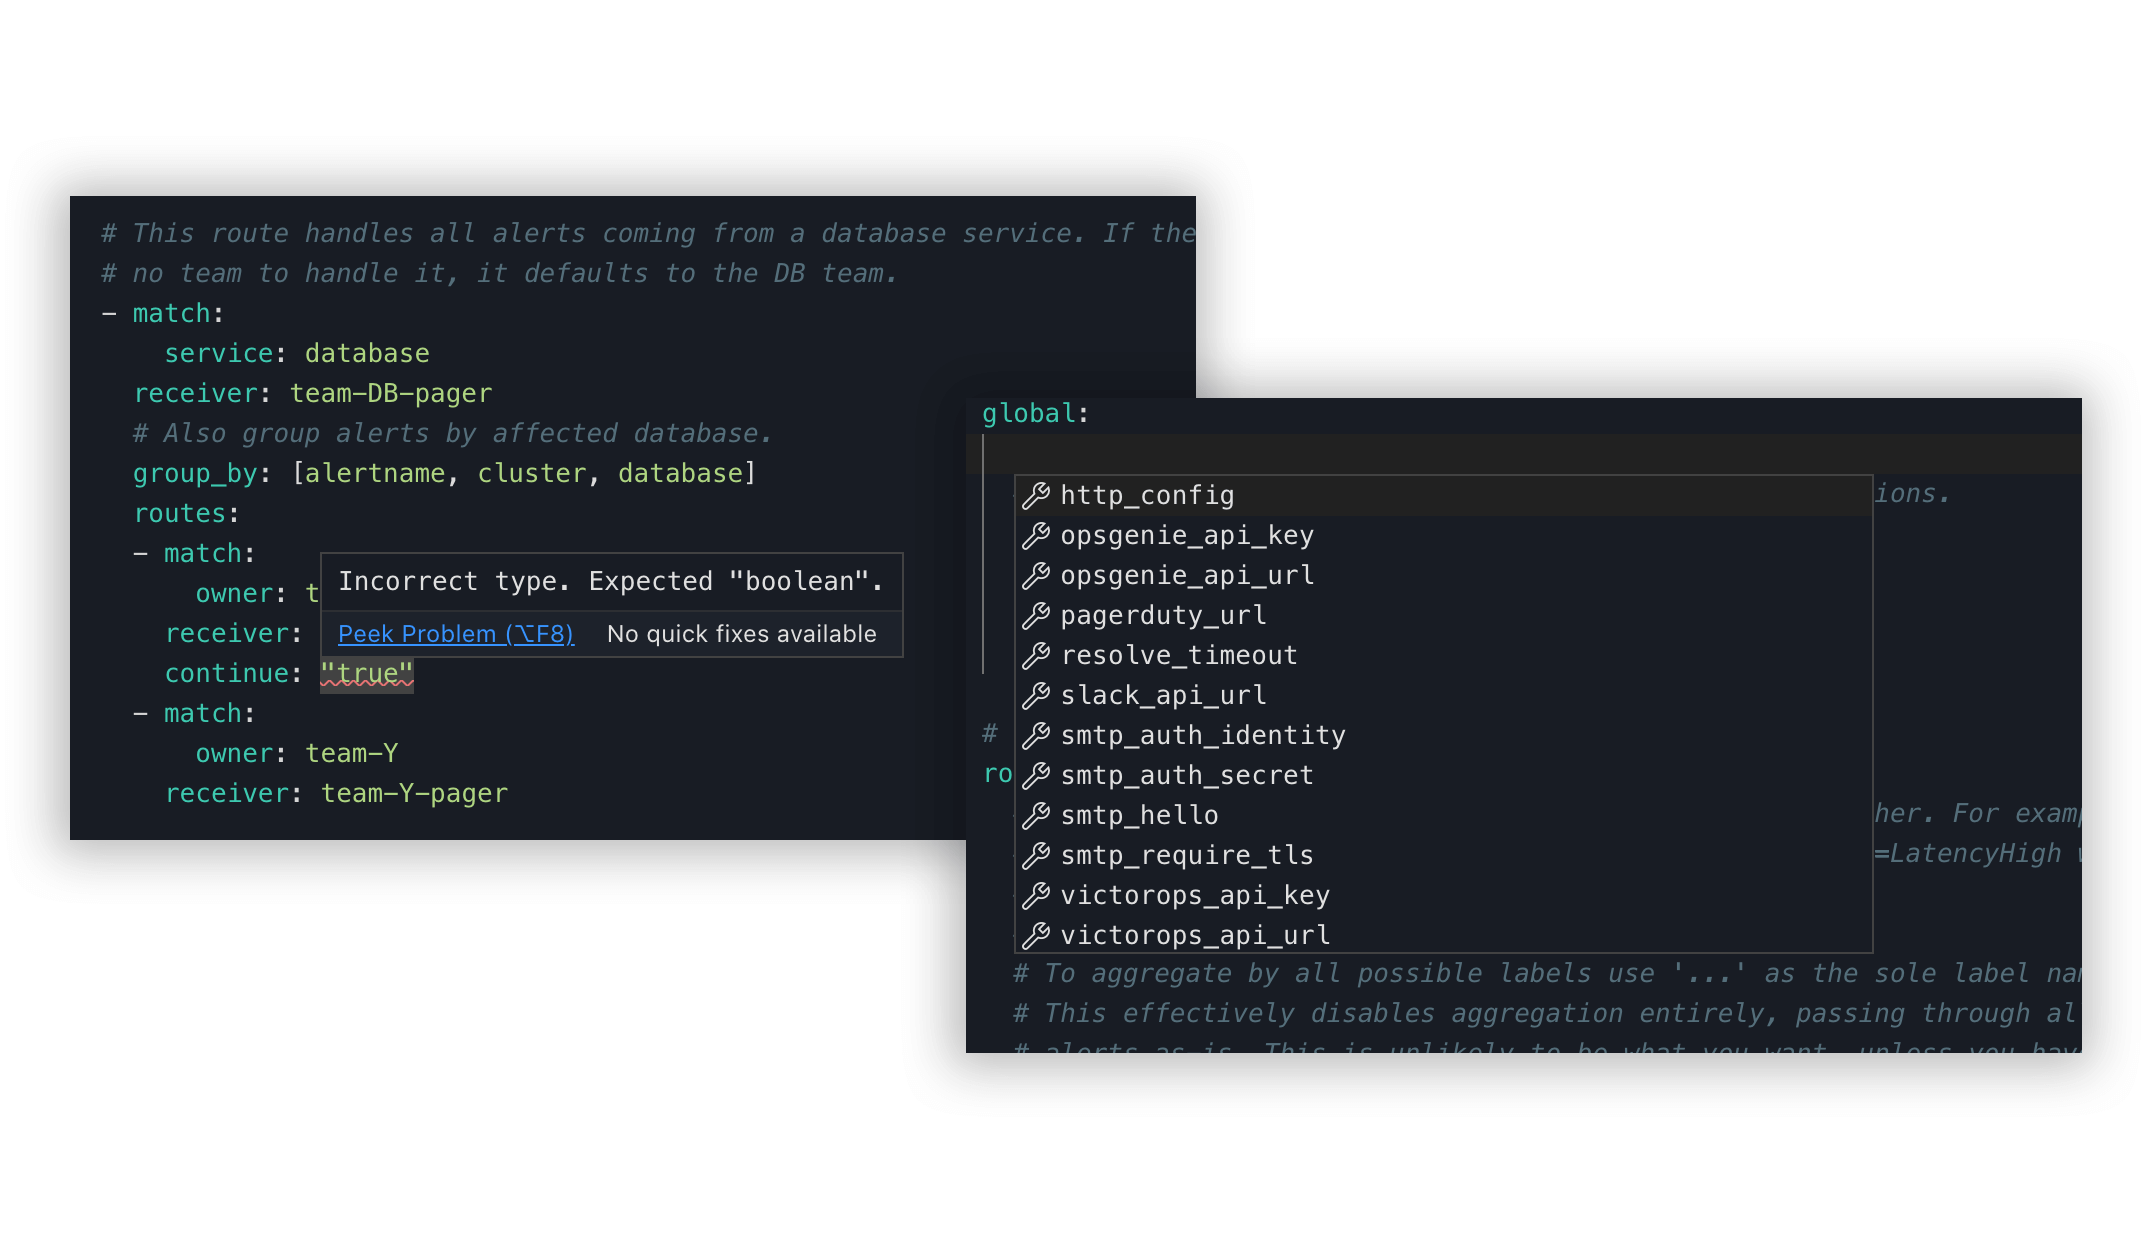
One of the newest features is our alerting UI, which provides editors with real-time validation feedback and auto-complete for both configuration and alert rules. This will make crafting alerts and configuring their delivery faster and less frustrating.

In the future, we'll also make it easy to share and sync configuration across tenants with tenant-specific overrides, give you a button to test alerting routes when the configuration has been changed, and provide an audit history in the service of transparency and compliance.
As a fun example to illustrate our thinking about this unified experience, we've built a command palette to help users navigate quickly between all of the previously disjoint components.

Lowering the Barrier to Open Source Observability
I hear some of you saying, "all of this is great, but now I have another tool I have to learn!".
Believe us when we say that we understand. We aim to make Opstrace feel familiar to people who already rely on open source monitoring tools while not compromising on making things better. In fact, bringing together complicated distributed systems into a unified system provides an opportunity to reduce the learning curve significantly.
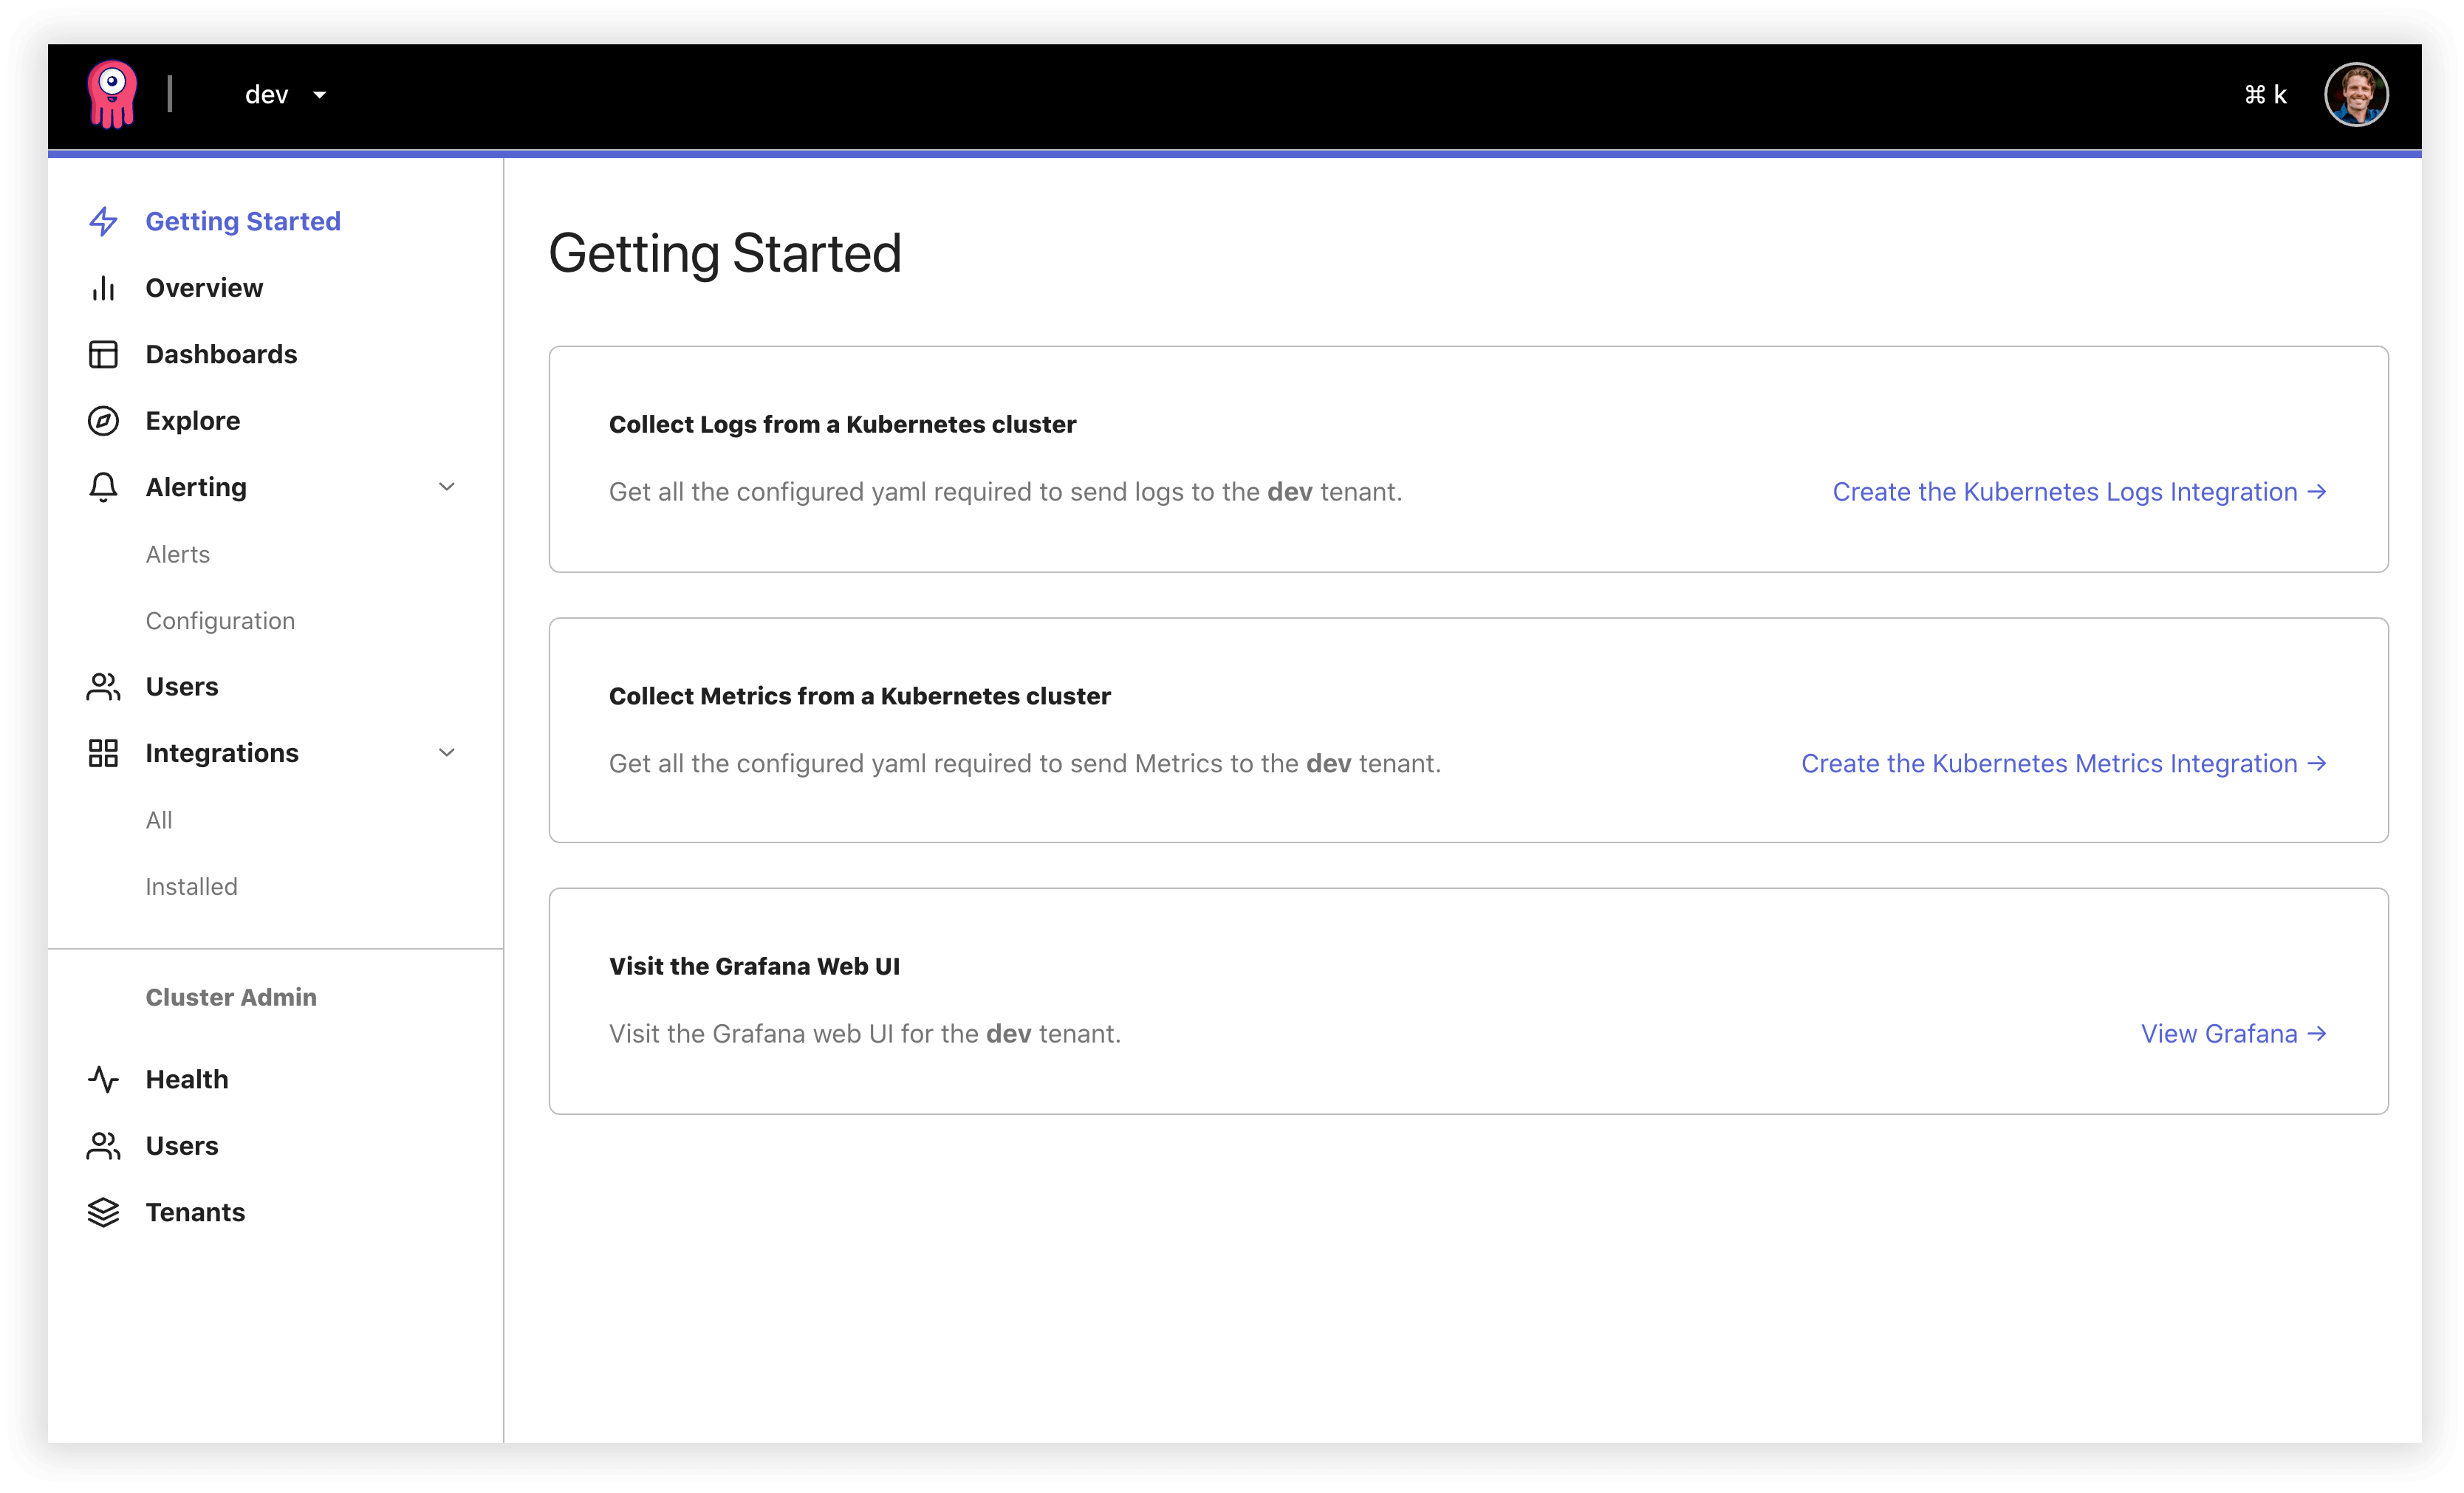
The first step to lowering the learning curve is to have a guide when you land in the UI for the first time. We aim to guide you through the next steps via the UI so you can go from zero to useful in less than an hour.
Once you're up and running, there's a lot more room to streamline day-to-day operations. We've seen many people (including ourselves) struggle with data collection for metrics and logs. It's death by configuration. One wrong parameter in your Prometheus configuration, and you can spend hours trying to figure it out. The scope of Opstrace extends all the way to reliable, tunable collection agents, wherever they may be.

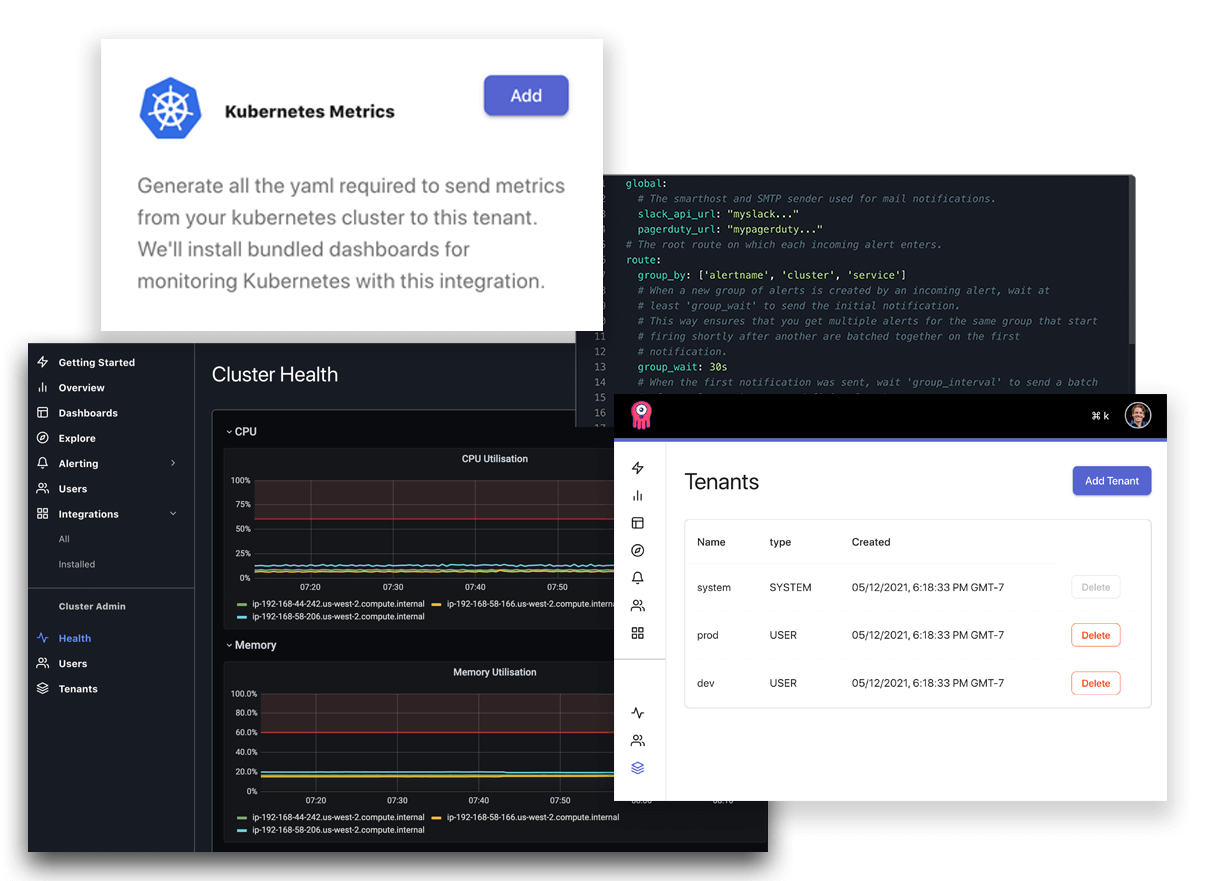
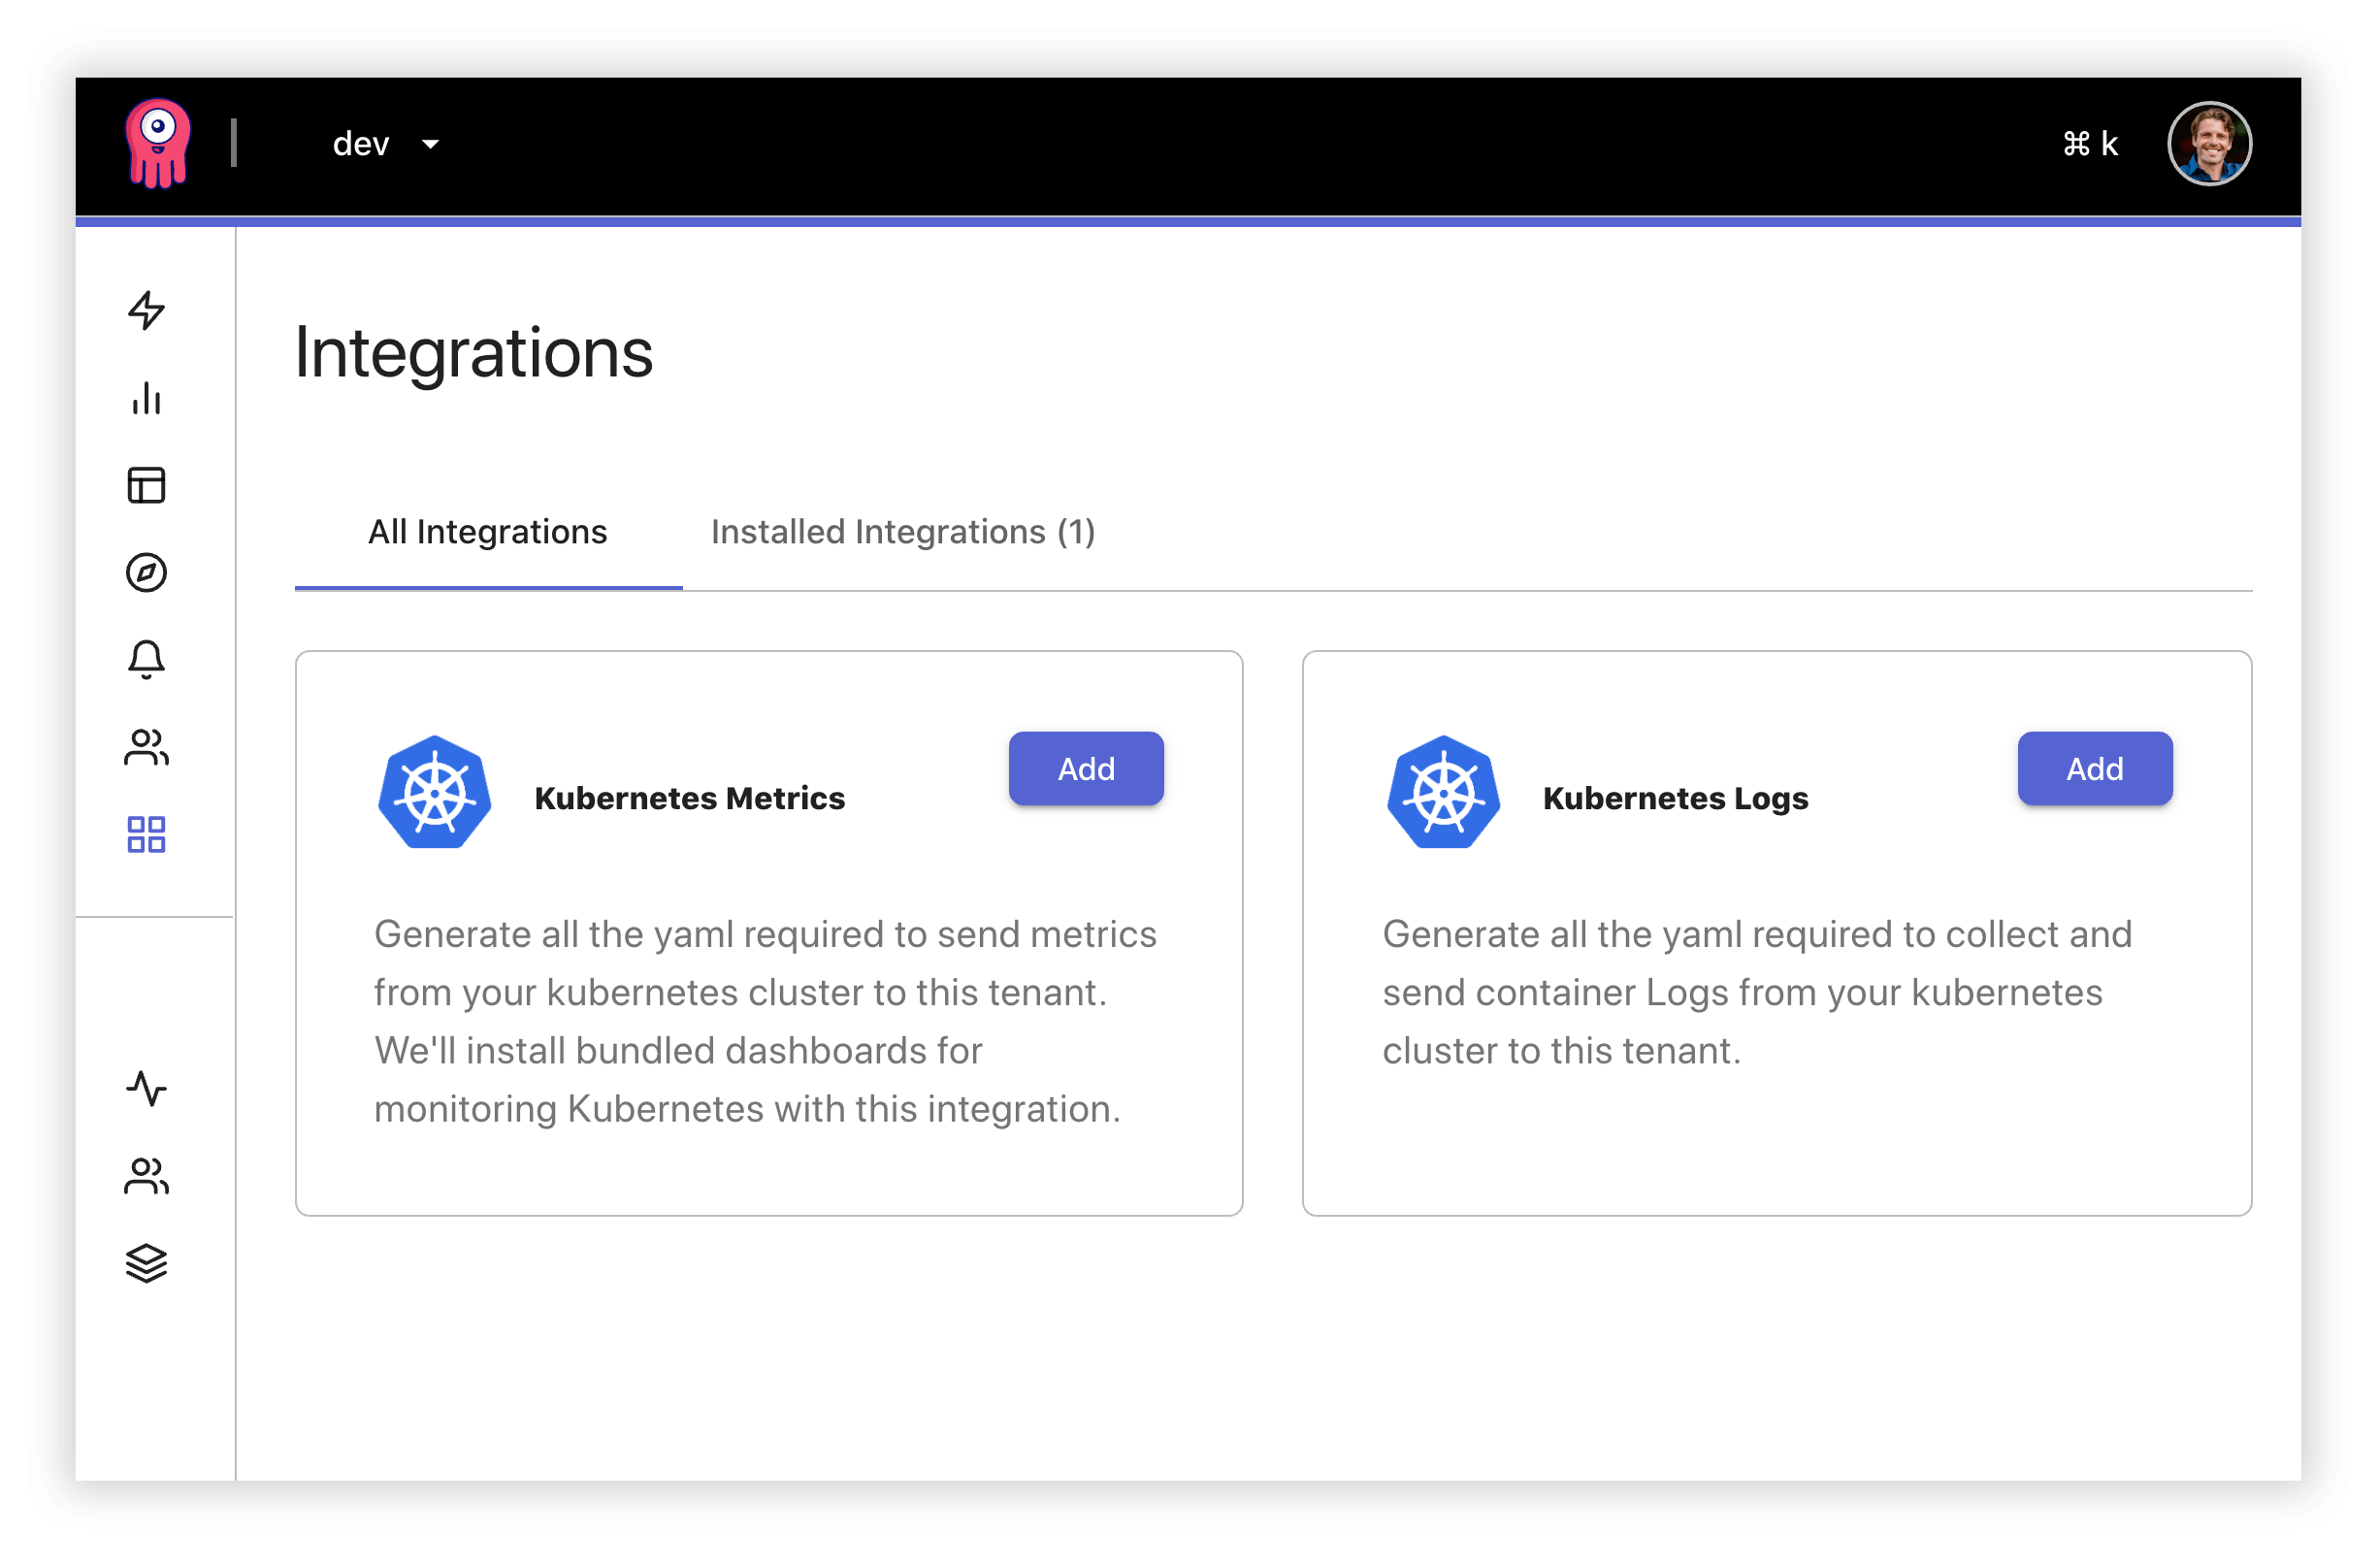
Introducing Integrations. Integrations in Opstrace are much like integrations in Datadog or Wavefront—they make collecting data and visualizing it as simple as clicking a button. The first two integrations we support are for collecting and visualizing Kubernetes metrics and logs. These integrations ask you for a target namespace and then generate all the YAML for you to download and apply to your Kubernetes cluster. Under the hood, we're using Prometheus and Promtail to collect these data types. The collection client is also preconfigured with authentication credentials for securely sending data to the desired Opstrace tenant.
Integrations also bundle and install into your tenant a set of dashboards that support the generated client configuration. We're already working on a number of other integrations that, under the hood, use open source Prometheus exporters to gather and visualize data.
In the future, you'll be able to select many other data sources such as an RDS instance or a CockroachDB installation, and with the click of the button, you'll have collection, dashboards, and alerts installed and ready to go.
Opstrace integrations are core to our mission. Over time we will build a solid catalog of commonly monitored software that anyone can use at the click of a button, reducing toil to a minimum.
User and Tenant Management
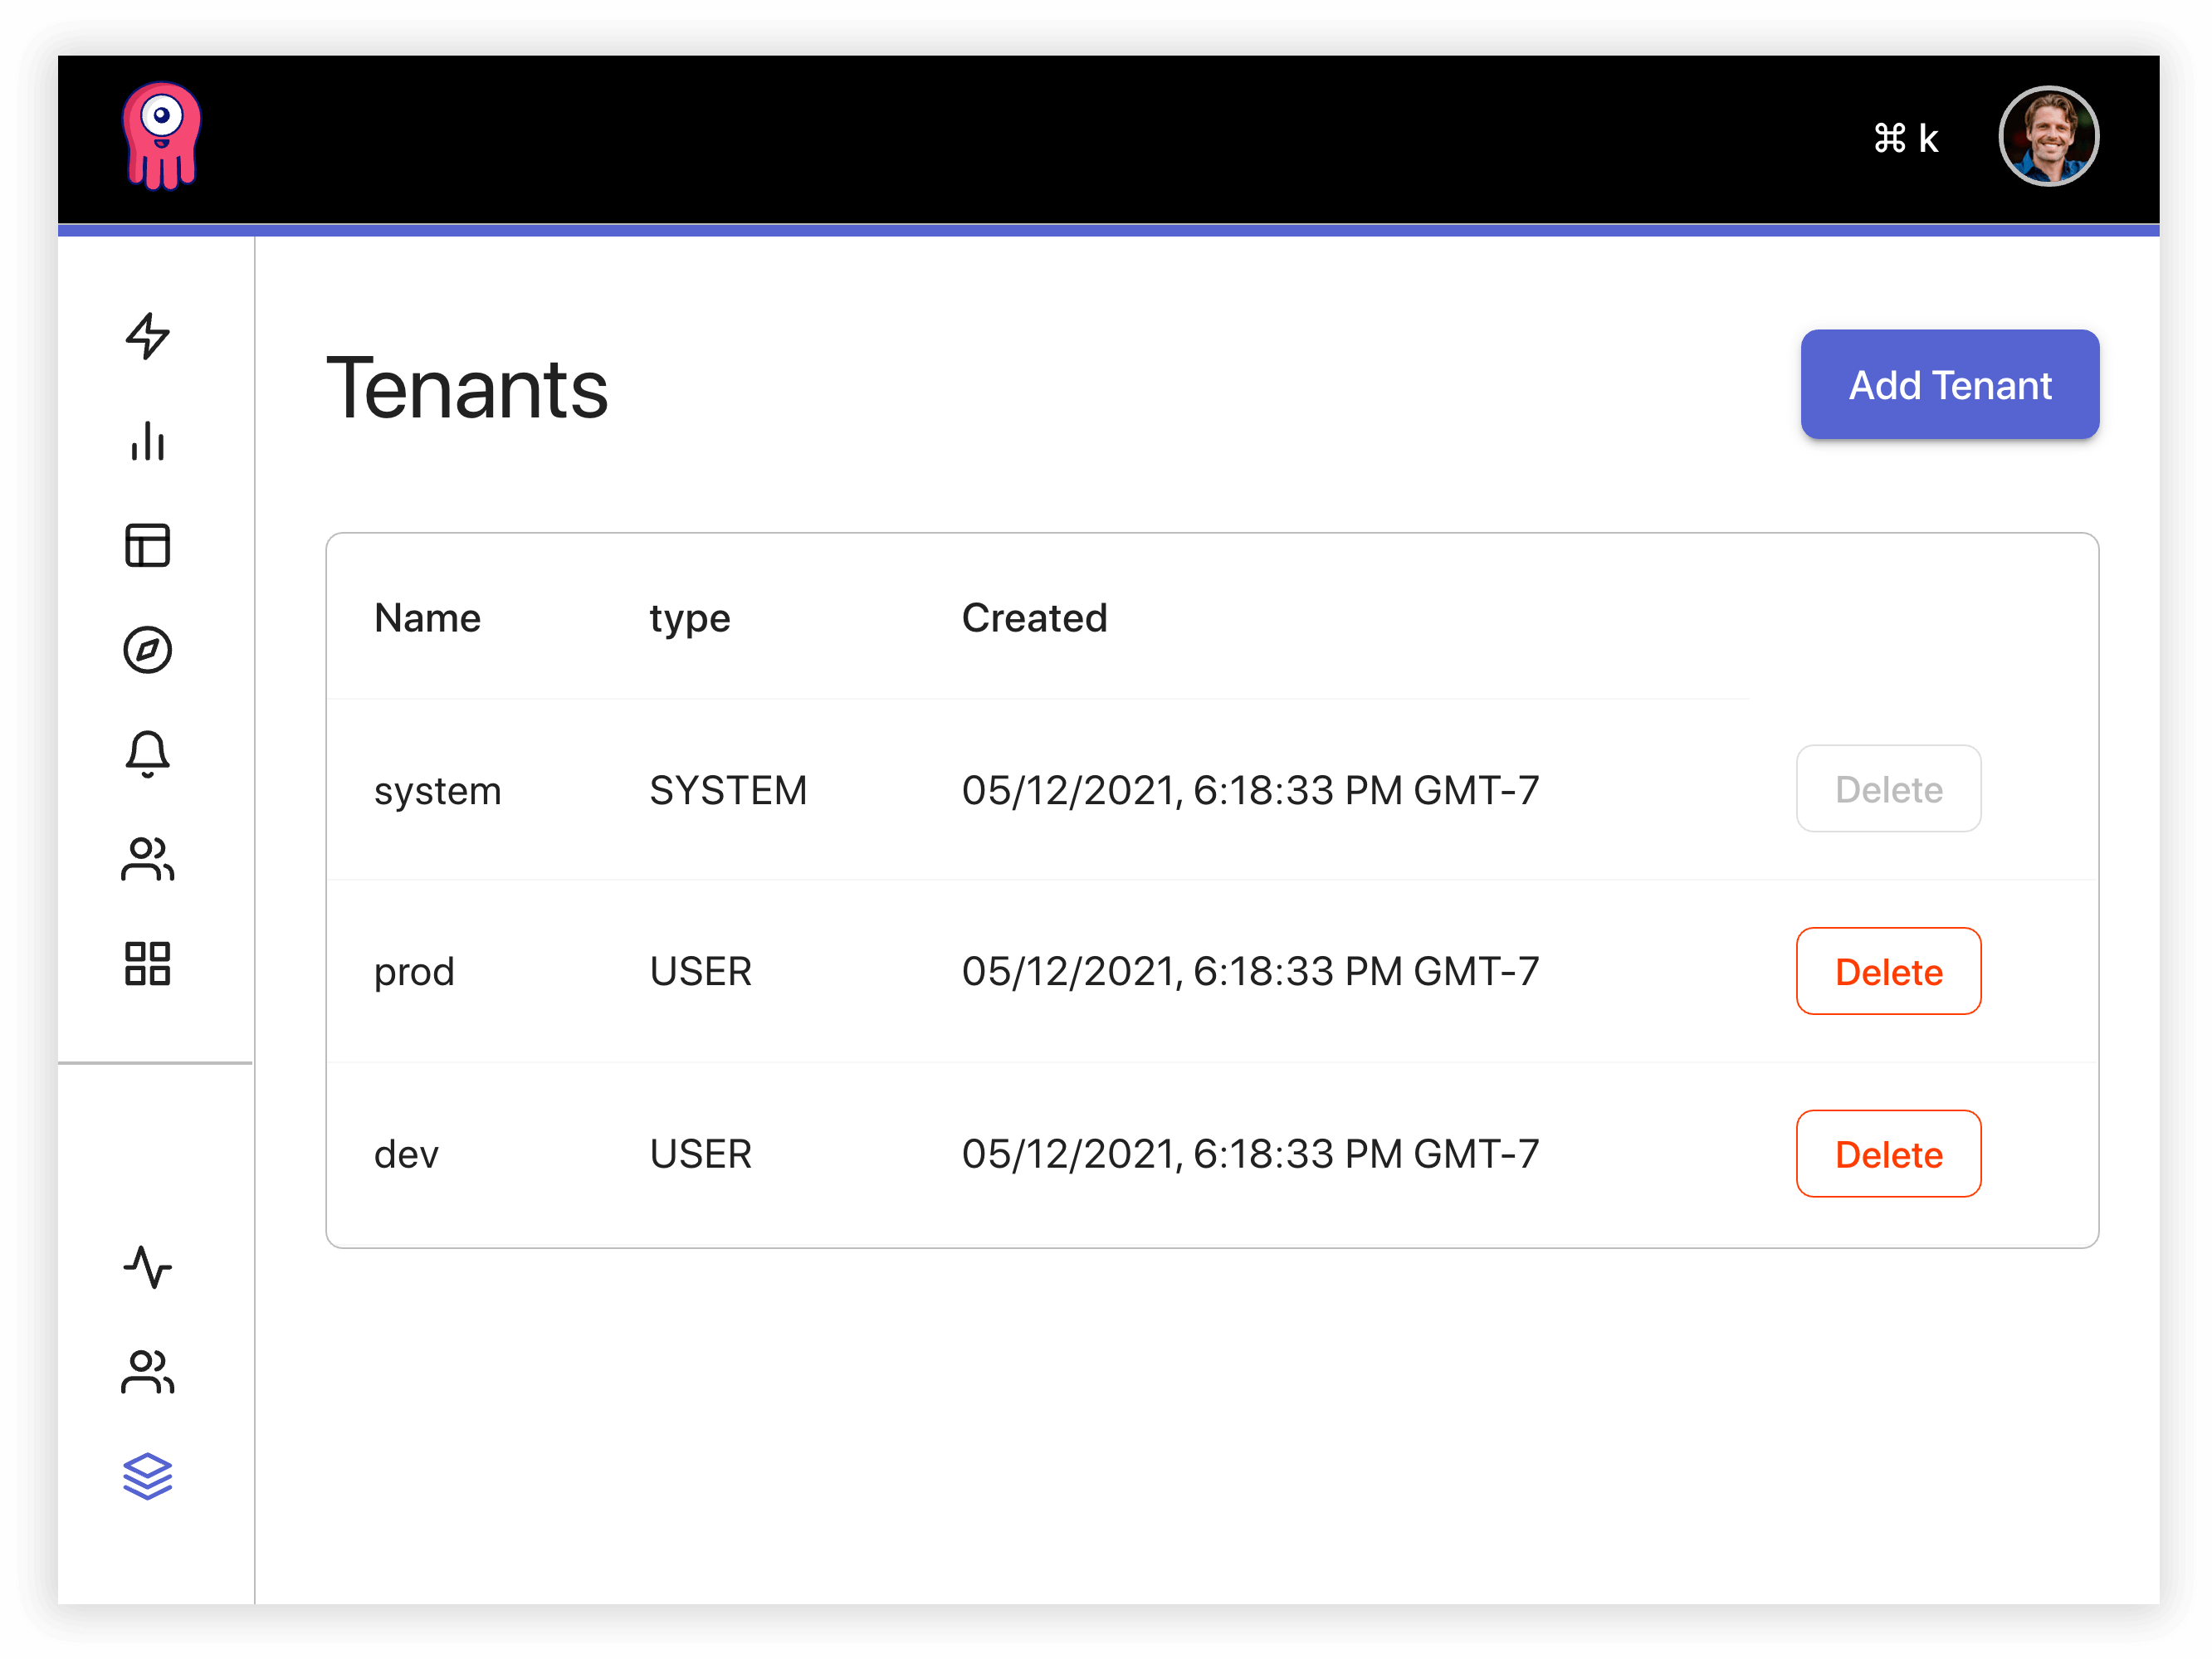
Opstrace supports multiple secured tenants to isolate data, dashboards, and API endpoints by team, environment, or anything else important to you. This provides centralized management for keeping users and permissions in sync across all tenants.
Soon, complete user, dashboard, and permission management will be administered from the Opstrace UI and then synced to the respective Grafana instances in each tenant. Changing user preferences or permissions in an Opstrace tenant will also result in that user's permissions being updated in the tenant's Grafana instance.
Conclusion
Our ultimate goal is to make open source observability easier, more accessible, and more effective. These new UI features in the observability distribution represent the first step toward solving serious existing pain points users have.
Engineers span the globe for many companies, and gone are the days where a few keen individuals hover around their colleague's desk to debug and resolve a production issue. It's time our tools evolve to fit this new reality, and this is the future we're building for.