


Mar 16 | 5 min read
Collecting Cloud Provider Metrics with Opstrace
Nick Parker

Centralize critical AWS/GCP service metrics alongside your application metrics
Prometheus is widely-used to monitor distributed applications, and for good reasons—it’s amazing, for many more reasons than we have space to go into here. But if you’re using Prometheus, chances are you’ve run into a problem: you have most of the metrics you want in Prom but some other (very critical!) metrics are stranded inside your cloud provider. For example, in AWS you probably have an ELB that you want to monitor, or in GCP you may want to track your GCS usage. Having multiple sources for metrics makes life difficult because you want to query and alert on all metrics in the same way. To solve this problem, people often add AWS CloudWatch and GCP Stackdriver as a data source in Grafana, but then quickly realize they can’t use Prometheus alerting. Others import the data into Prometheus using additional exporters; that is yet more knowledge to be acquired and infrastructure to maintain.
In this blog post, we will show you how we incorporated the open source exporters into Opstrace to automate their configuration and maintenance. We’ll first tell you about how we implemented this and how it works. Then we will show you how to do all of this by providing Opstrace with cloud credentials and configurations for the metrics to collect, and then querying back the data using Grafana. Finally we will talk about how support could be extended to other exporters as well as service discovery configurations.
Implementation
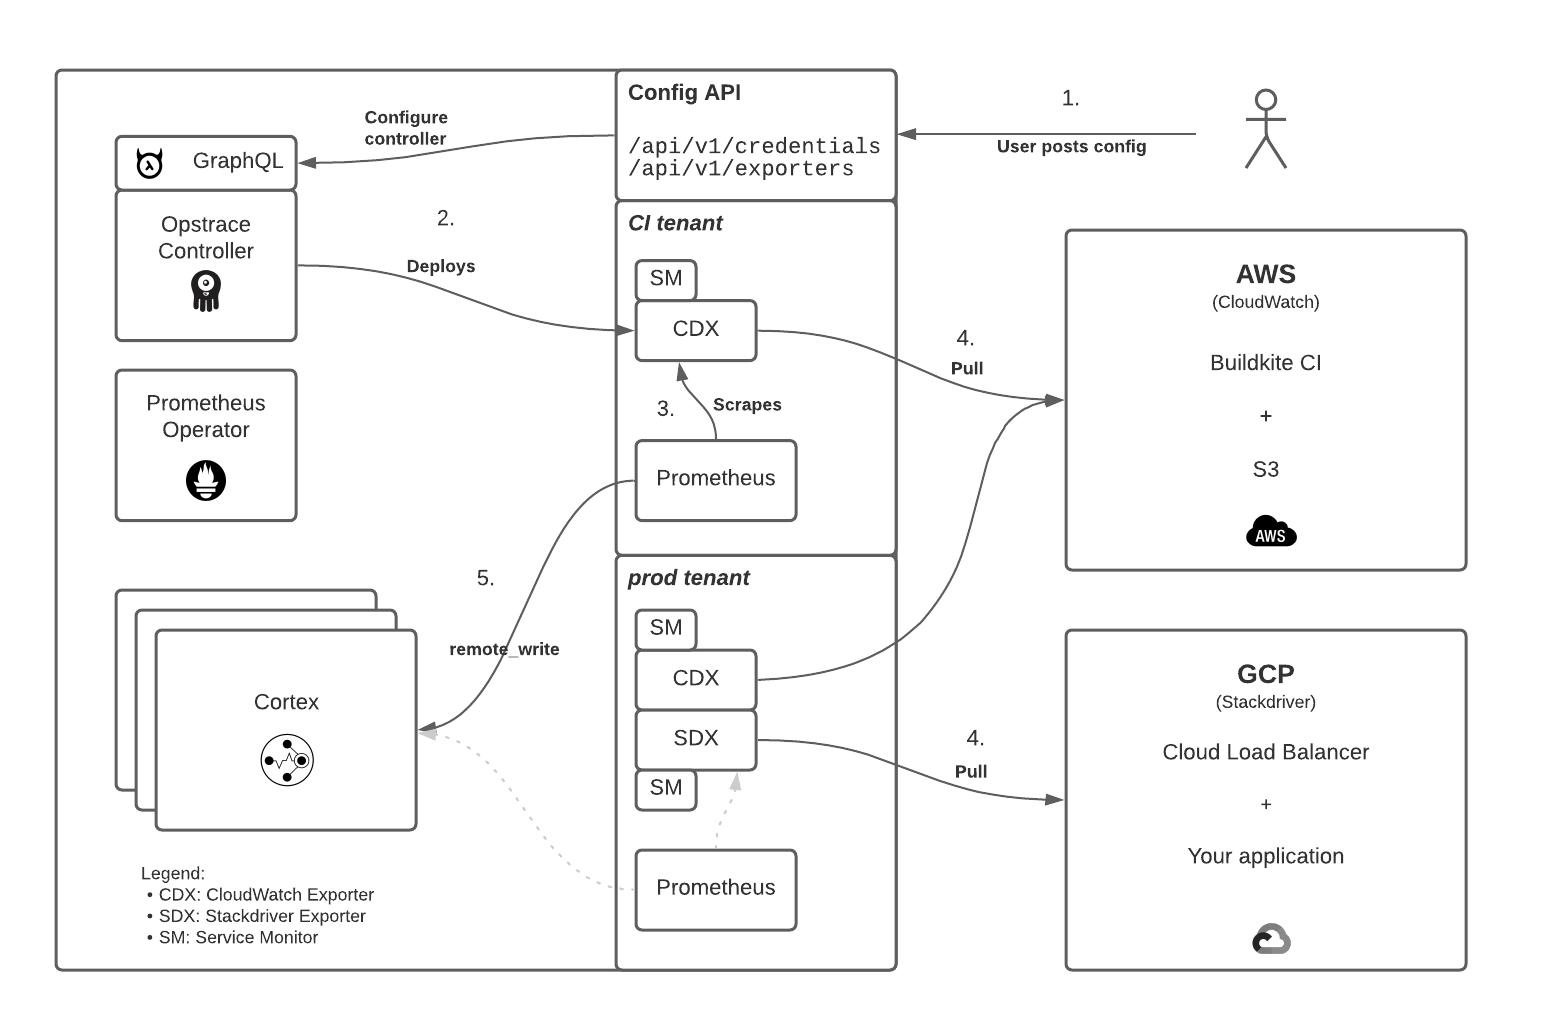
As you submit credentials and collection configurations, exporters are started within Opstrace to pull the metrics from CloudWatch and Stackdriver. The configurations themselves are a direct passthrough to the underlying exporter implementations and Opstrace deploys stock builds of each respective exporter type. This simplifies debugging the exporters and makes the configurations portable into and out of Opstrace. This structure may also support higher-level GUI-based configuration in the future.
Opstrace internally stores your submitted credentials and exporter configurations directly to Postgres, acting as a backing store to a Hasura GraphQL interface. Note that the credentials are currently only stored as plaintext within Postgres and must be scoped to only allow metrics collection. That said, the configuration API requires authentication and does not return credential values after they have been submitted. As an additional step, we may in the future introduce a separate secrets store as a replacement for the current Postgres-based storage.
The credential and exporter configuration changes are detected by the Opstrace Controller as GraphQL updates. As configurations are updated, stock release builds of the CloudWatch and Stackdriver exporters are deployed into each tenant. This structure supports the addition of additional exporter types over time. The deployed exporters serve the configured metrics in Prometheus format to be collected and made available within Opstrace.

Quick Start
We will configure both AWS CloudWatch and GCP Stackdriver collection to be sent
to a tenant named dev. We use the corresponding tenant-api-token-dev auth
token file created by the Opstrace CLI during installation. For convenience the
configuration APIs accept one or more objects. Multiple credential or exporter
types may be included in each request.
First we will submit the AWS and GCP credentials, naming them
example-aws-credential and example-gcp-credential respectively:
NOTE: These credentials must be scoped to allow fetching metrics and nothing else.
$ echo 'name: example-aws-credentialtype: aws-keyvalue:AWS_ACCESS_KEY_ID: sample-key-idAWS_SECRET_ACCESS_KEY: sample-access-key---name: example-gcp-credentialtype: gcp-service-accountvalue: |-{"type": "service_account","project_id": "sample-project-id","private_key_id": "...","private_key": "...","etc": "etc"}' | curl -v -H "Authorization: Bearer $(cat tenant-api-token-dev)" --data-binary @- https://me.opstrace.io/api/v1/credentials/
Next we submit the CloudWatch and Stackdriver exporter configurations,
creatively named example-aws-exporter and example-gcp-exporter. These
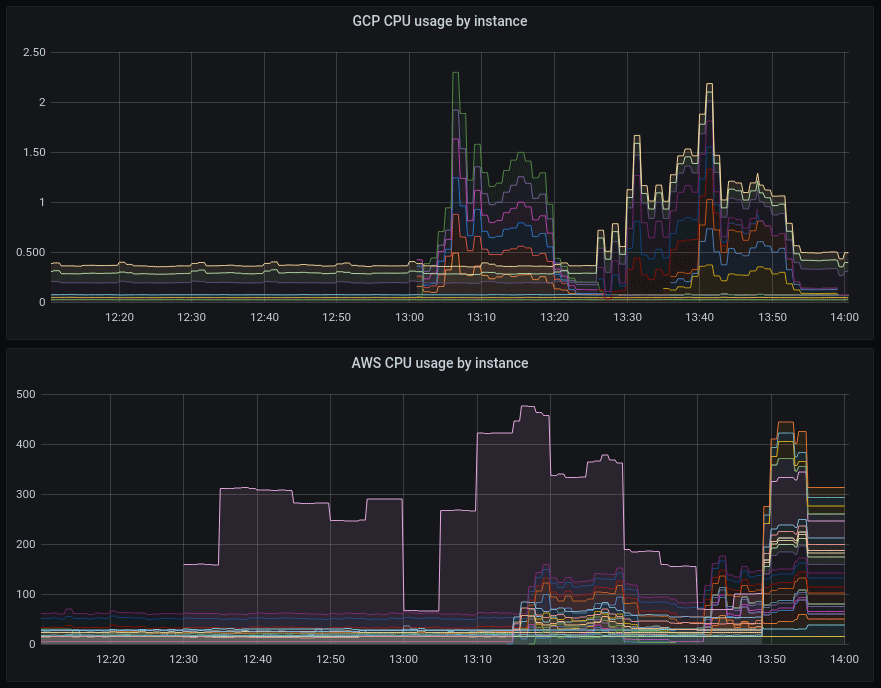
reference the credentials from the last step. In this example we are retrieving
EC2 CPU usage and custom Buildkite CI metrics from CloudWatch, and CPU, disk,
and network usage and allocation metrics from Stackdriver. The configuration
follows the format used by
CloudWatch Exporter
and
Stackdriver Exporter:
$ echo 'name: example-aws-exportertype: cloudwatchcredential: example-aws-credentialconfig:region: us-west-2metrics:- aws_namespace: AWS/EC2aws_metric_name: CPUUtilizationaws_dimensions: [InstanceId]aws_statistics: [Sum]- aws_namespace: Buildkiteaws_metric_name: ScheduledJobsCountaws_dimensions: [Org, Queue]aws_statistics: [Sum]- aws_namespace: Buildkiteaws_metric_name: RunningJobsCountaws_dimensions: [Org, Queue]aws_statistics: [Sum]- aws_namespace: Buildkiteaws_metric_name: WaitingJobsCountaws_dimensions: [Org, Queue]aws_statistics: [Sum]---name: example-gcp-exportertype: stackdrivercredential: example-gcp-credentialconfig:monitoring.metrics-type-prefixes: # required- compute.googleapis.com/instance/cpu- compute.googleapis.com/instance/disk- compute.googleapis.com/instance/networkgoogle.project-id: # optional- sample-project-idmonitoring.metrics-interval: '5m' # optionalmonitoring.metrics-offset: '0s' # optional' | curl -v -H "Authorization: Bearer $(cat tenant-api-token-dev)" --data-binary @- https://me.opstrace.io/api/v1/exporters/
At this point Opstrace will begin collecting the metrics we've configured in the
dev tenant.

Outlook
This process makes it easy to get any metrics we may want out of CloudWatch and Stackdriver, even across multiple AWS and GCP accounts. To maximize flexibility and portability, we use a low-level API for configuring the credentials and metrics to collect. We will supplement with a GUI-based configuration interface on top of this layer and make it easier to discover and select the metrics to be collected from CloudWatch and Stacktrace. We've also set up a good foundation for supporting other external data sources in the future... is there anything else, in particular, you'd like to collect? Let us know in GitHub or by email.