


Mar 23 | 5 min read
Why we chose Cortex and Loki
Observabiltiy data belongs in object storage
Object storage like S3 is eating the database world. It is cost-effective and resilient—no local volume management and disk failures, near infinite scalability, and a whole lotta nines. We believe this is the future for high-volume Observability, so we began our journey to find the databases we'd start with as backends for the Opstrace platform… we hope you can learn from it.
Metrics
On a small scale, most things are easy. Prometheus on a single node or a SaaS vendor's free tier work very well. Problems start when you start to scale. Traditionally this is done by feeding Prometheus more CPU, more RAM, and more disk space; or paying a vendor more and more money. But at some point, this becomes untenable. Ultimately you want your data to be available as you grow, retained for the long-term, and all done in a cost-efficient way (disk, in the cloud, is not cheap). Complicating matters further, user queries drive unpredictable load, and if they are ever too big or complex, they will hog the resources of your single instance, starving everything else.
At the time, there were multiple open source projects working on similar issues: two were Cortex and Thanos.
Thanos took a super interesting approach of keeping things easy for existing Prometheus users; by adding a "sidecar" for Prometheus, the compressed TSDB blocks would be shipped to an S3 bucket and lightly indexed. This is a brilliant approach because it solves the long-term storage problem while keeping the operational overhead as close as possible to running default Prometheus. But that simplicity has a cost: scalability.
Cortex had an answer. Cortex borrowed Prometheus code and APIs and created a horizontally scalable version of it. It separates a write path from a query path such that both can be scaled independently. It is also multi-tenant by default and has read and write rate limits that can be centrally configured. One limitation (at that time) was that while it could use S3 to store the raw data (the actual time series data), it had to use a database like DynamoDB or Cassandra for the index (for searching by labels and not solely time).
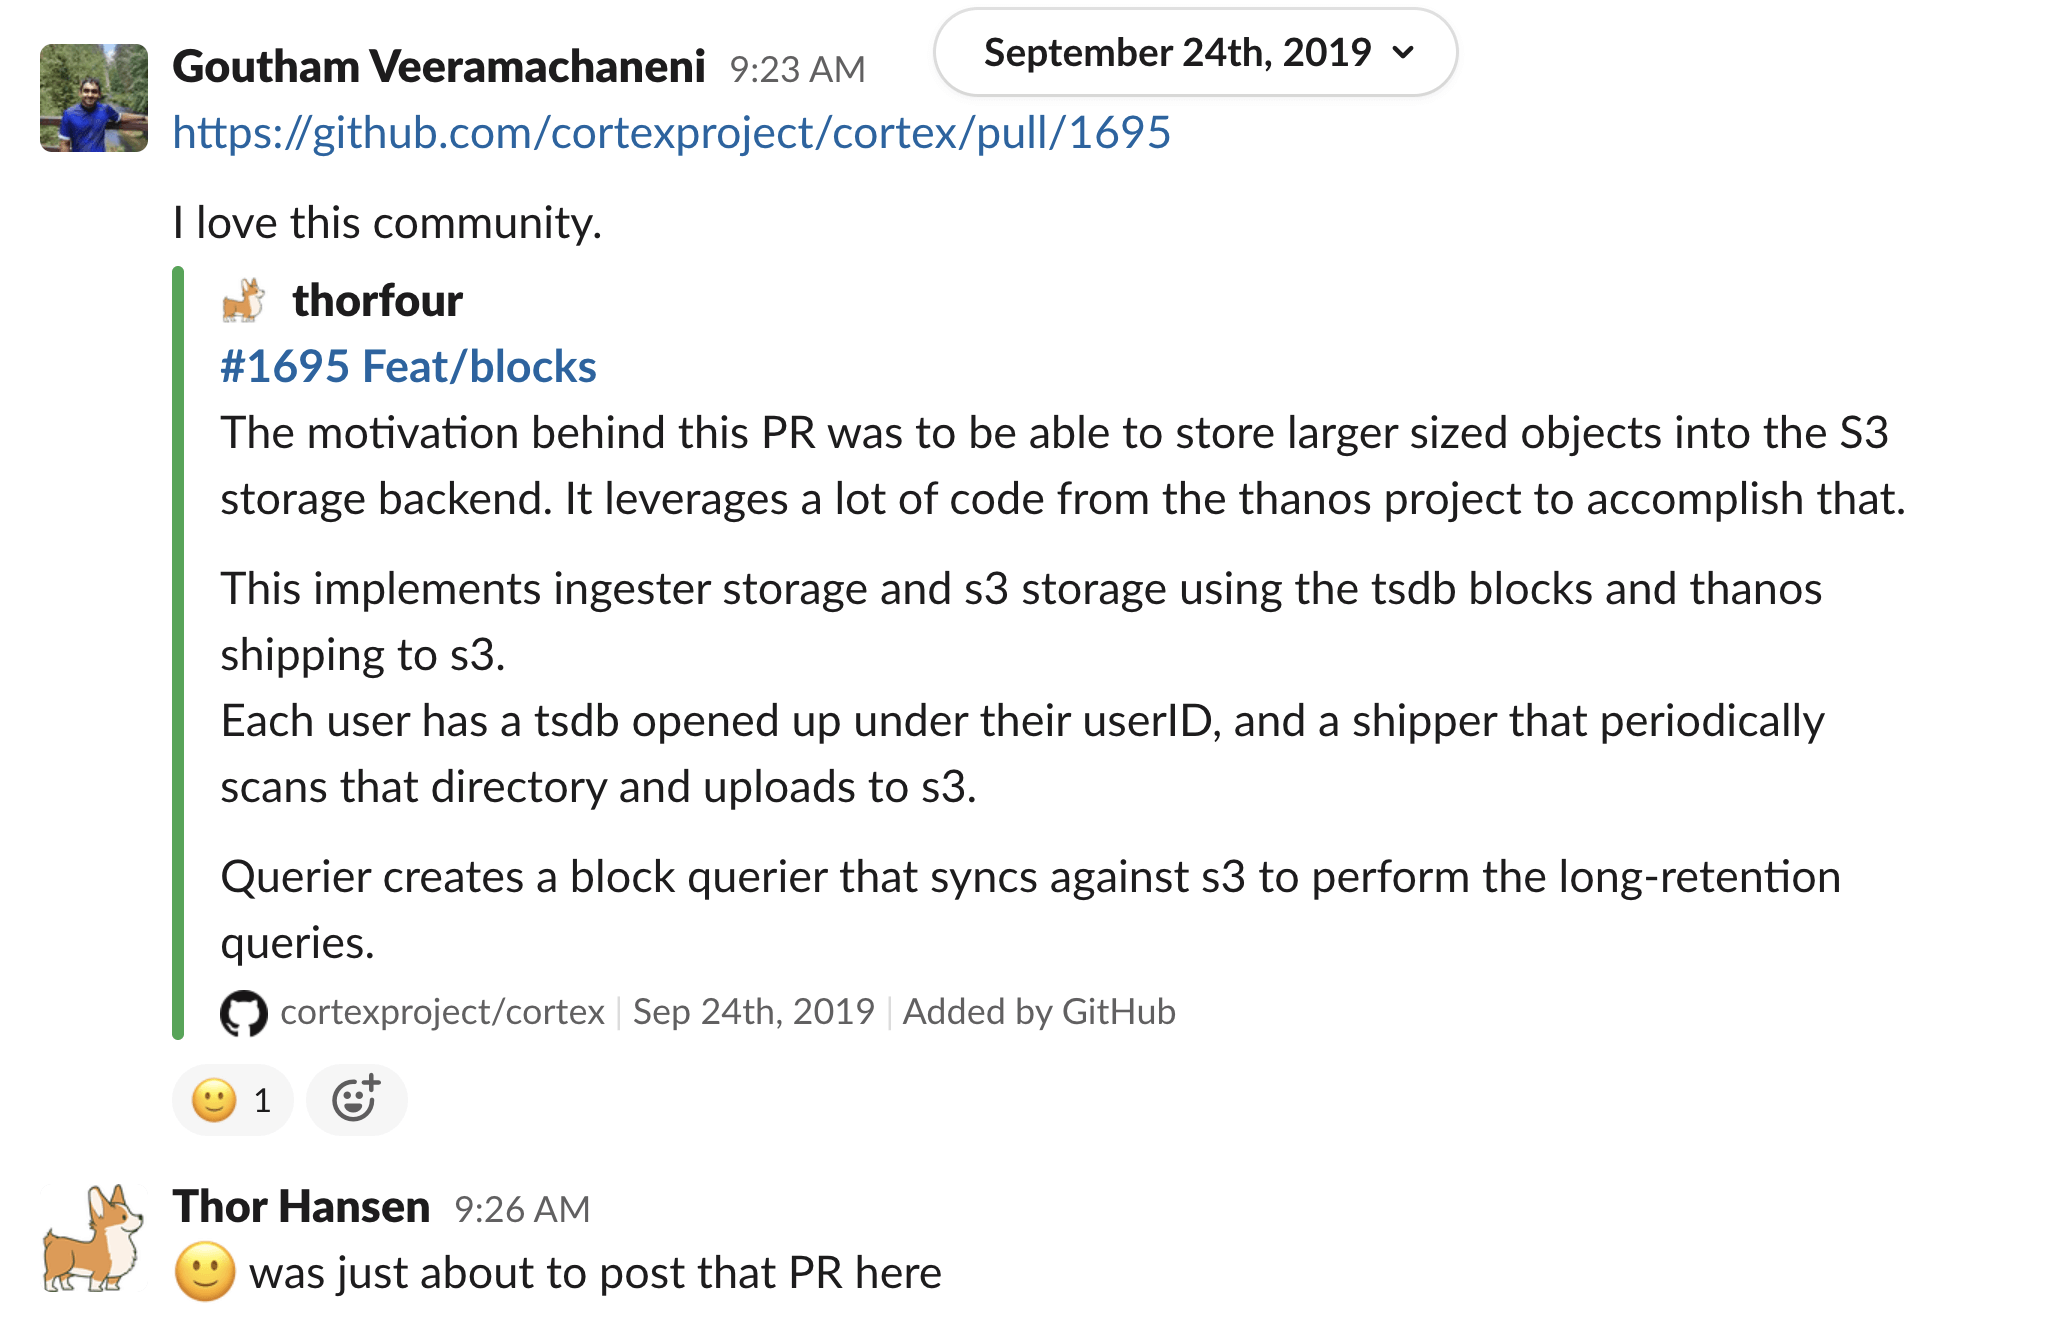
And this is where the magic of open source happened. What started with a sizable PR from a single developer blossomed into an intense collaboration between two communities. They worked together on a new backend for Cortex that uses Thanos to store and index the data solely in S3, no more external DB! You can read more about this effort on their blog, and see how it all started via the CNCF Slack history:

Logs
Logs have been around forever, and for a good reason—they provide rich detail when you need fine-grained information from all parts of your application. They are different from metrics in many ways. For example, a full-text search index over unstructured logs may help you find what you are looking for but is far larger than any TSDB... and, in practice, far more expensive. Many people accidentally back themselves into a corner ending up with surprise bills. They then spend time pruning the logs they collect to get the budget under control. However, they no longer have a single place to access their logs.
Like our thought process while evaluating Cortex (i.e., using S3 to eliminate costly databases), we realized we could significantly reduce the cost profile if we could eliminate the full-text index. This is computationally infeasible with totally unstructured logs… but if we add a bit of structure, the problem becomes tractable.
Enter Loki, a relatively new open source project from Grafana. In the simplest terms, you can think of it as a distributed grep for your logs (though it can do much more!). You can't ask any random question of it, like with Elastic and its full-text index, but for infrastructure observability, it does at least 90% of the job at a small fraction of the cost and operational complexity. Loki uses the same ingestion/storage methods that Cortex does. (In fact, it shares code with Cortex.) By applying labels to your data during ingestion, you can filter down the working set of data to improve query performance.
Initially, Loki did not use S3 exclusively, but the signs were there that this nascent community would grow aligned with Cortex's direction. The initial PR enabling this solved the problem by expanding the BoltDB backend to upload index snapshots to S3. This was a pragmatic and straightforward solution that ends up working quite well.
Traces
Of course, there is much more to observability than just metrics and logs. We're currently evaluating a backend for tracing, and Tempo is a strong candidate. But one of the key aspects of observability still to be solved well in the open source world is storage for high cardinality data that allows asking arbitrary questions. Thankfully, there is a lot of exciting software out there that could be the building blocks of such a system: PrestoDB with backends specific to the Cortex and Loki S3 schema, or even more ambitious projects like InfluxDB IOx that would store any arbitrary event.
Conclusion
Opstrace is not in the business of building observability databases; our goal is to automate their operational burdens and make them more accessible in a single cohesive system to a broader range of users. We evaluated and chose good backends for metrics and logs and are looking forward to expanding to more data types to provide a truly complete, easy-to-use platform.
If you're interested in democratizing the use of scalable observability backends, which use cases they unlock, or other related topics, please join us at github.com/opstrace/opstrace and tweet questions to @opstrace.