


Jul 9 | 6 min read
What is Multi-tenancy?

What does a tenant in Opstrace include?
We often hear, "what is a tenant in Opstrace?" In this post, we bring together all of the main concepts, so you understand how Opstrace handles multi-tenancy. But first, let’s touch on the larger question: what is multi-tenancy?
Multi-tenancy is the concept of logically isolating tenants from one another while sharing some underlying infrastructure. A tenant exposes a set of logical resources and behaviors to which a group of users—human or machine—have common access rights.
Using multiple tenants for observability can be useful in many ways:
- Isolating environments, such as production, staging or development;
- Enforcing security by keeping data private between groups;
- Reducing operational overhead by making dynamic tenant creation fast, on top of the same underlying physical infrastructure;
- Offering different service levels to groups, for example, different rate limits for different teams; and
- They can be organized and combined in any other way that is meaningful to you and your organization.
Implementing multi-tenancy comes with several challenges. The first are correctness and security—tenants need to work such that users in one tenant cannot access the data or services of another, and it is very difficult to bolt this on to something that is already in production. Rate limiting must be applied to the tenants such that one bad actor cannot impact the overall system performance; the capacity of the underlying system must be planned in a way that will provide some calculated buffer accounting for those limits. Furthermore, you have to control all of these variables while managing the components of the tenants—adding, removing, resizing… there’s a lot to support.
The underlying open source projects that Opstrace leverages are multi-tenant from the ground up. Opstrace augments these with secure-by-default endpoints, dynamic tenant creation, and (eventually) dynamic rate limiting.
What is an Opstrace Tenant?
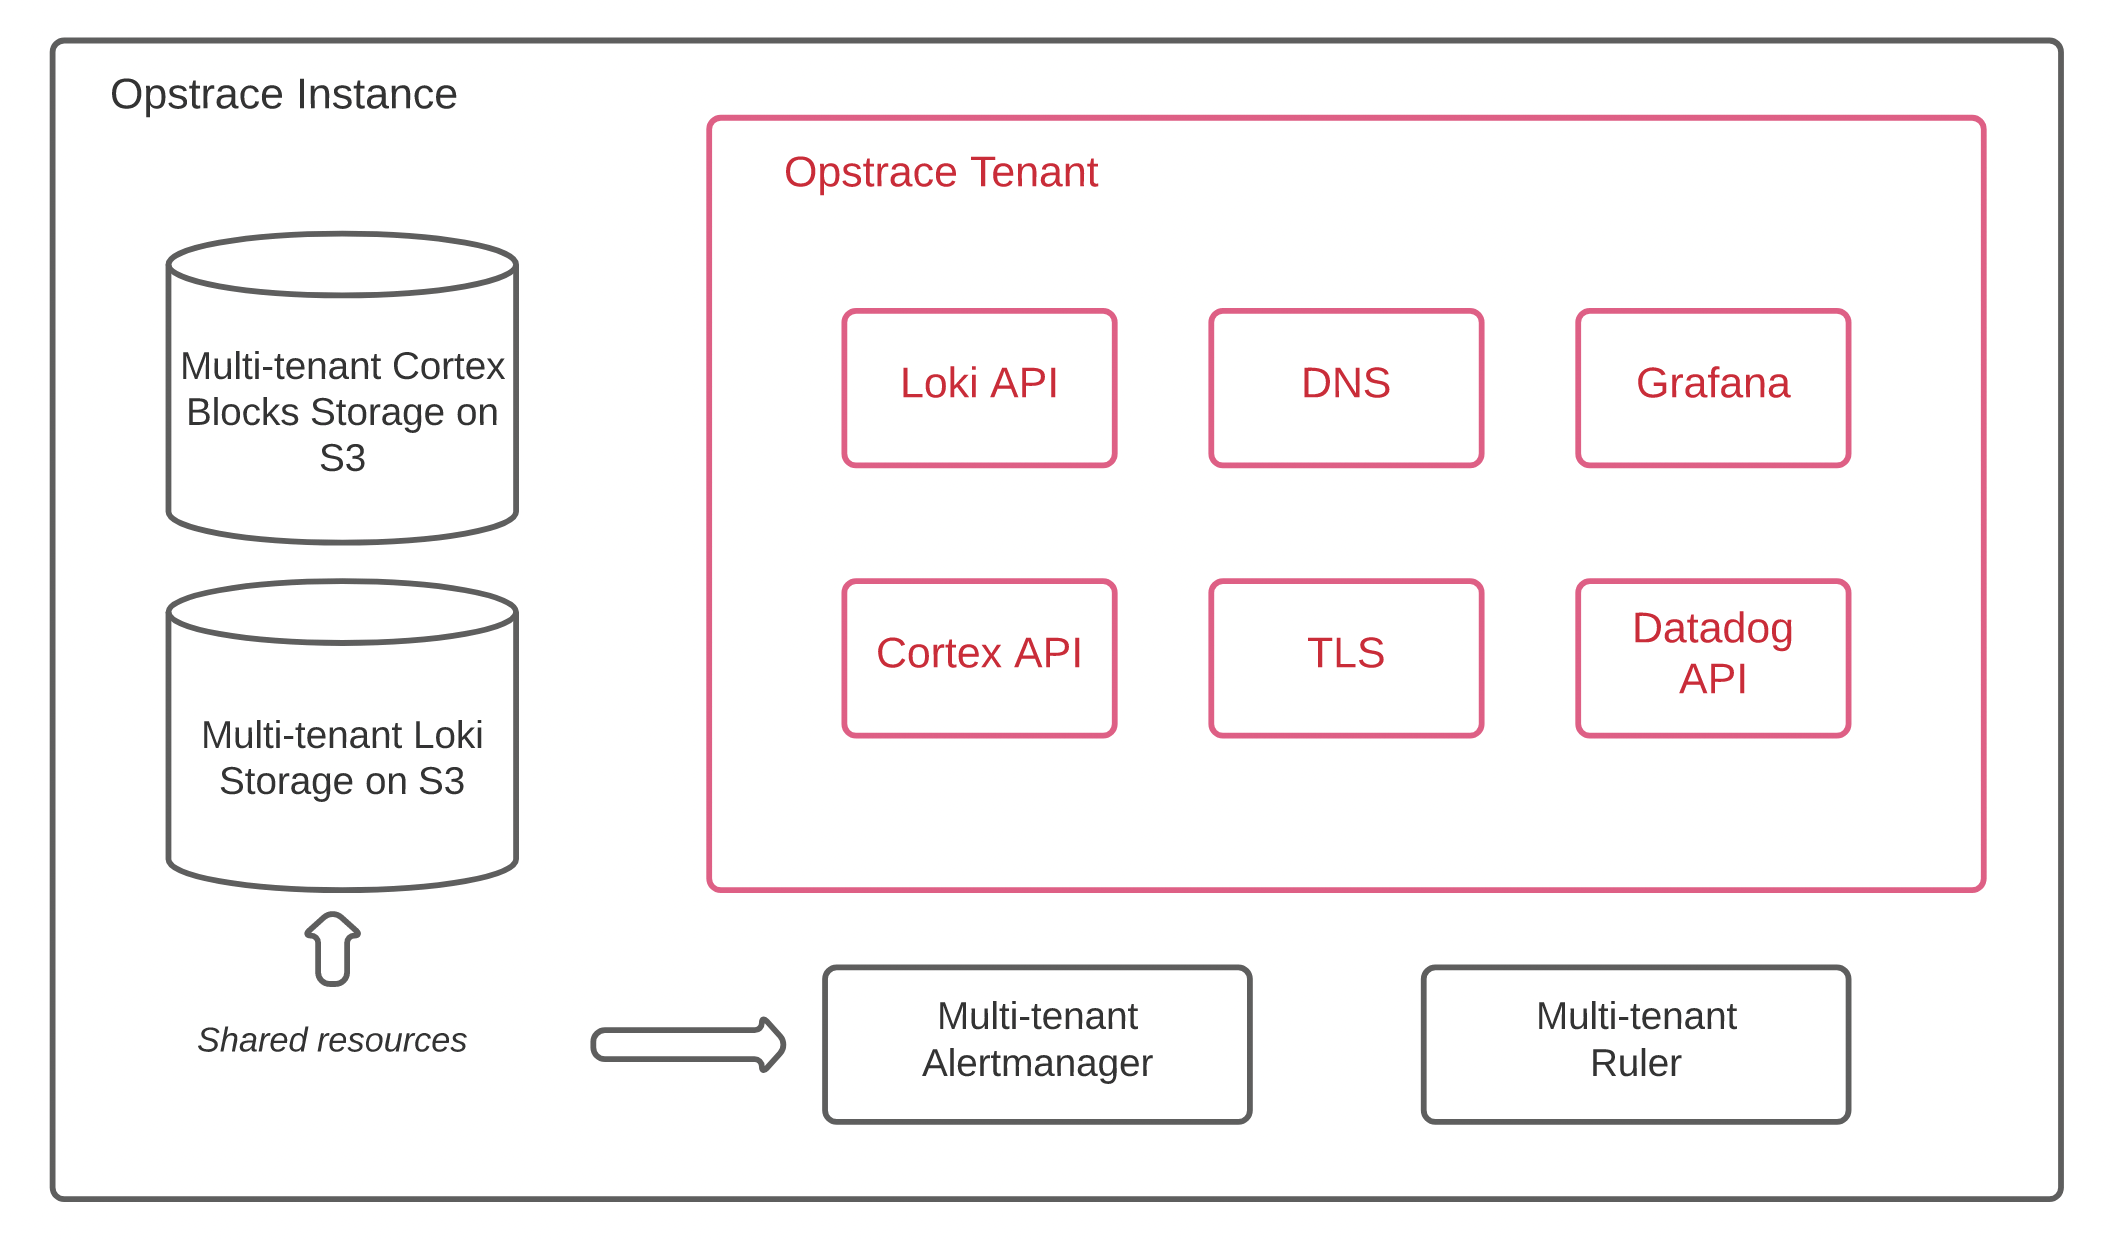
An Opstrace tenant is a logical grouping of resources that supports a complete collection -> ingest -> query pipeline. More concretely, it is a grouping of components (processes and configurations [1]) that Opstrace provisions behind the scenes and makes available to you in a user-friendly way.
The components of a tenant include secure APIs for both Cortex and Loki (read and write paths), an open source Datadog API, custom DNS subdomain, TLS certificates provided by Let’s Encrypt, and a Grafana instance dedicated to displaying only the data ingested into this tenant. Each of these components interacts with the underlying shared components—which are themselves multi-tenant by design:

The Secure API is a gateway for Cortex and Loki. It offers a secure HTTP API with TLS and requires authentication proof in the form of a bearer token. (We recently published a blog post about creating new, secure tenants.)
Opstrace ships with an open source Datadog API. This implementation enables an easy migration path for those currently using Datadog. The DD Agent can be configured to write to our secure API, which will then store your DD metrics alongside all of your other metrics so you can query and alert on them uniformly.
Opstrace creates custom DNS names to provide a clear, human-readable path
for you to access your Opstrace Instance. For example, in an instance named
tracy with a tenant named prod, you would point your metrics collection
agent to https://cortex.prod.tracy.opstrace.io/api/v1/push. Likewise, you can
access the tenant Grafana UI via https://prod.tracy.opstrace.io. Currently
opstrace.io is offered for free by default. Still, we are currently building a
feature to allow you to bring your own domain and Auth0 integration,
sidestepping the Opstrace free DNS offering completely.
The primary query interface for human users is Grafana. Because open source Grafana itself is not multi-tenant, a dedicated instance is configured and provisioned automatically for each tenant.
Tenant management is offered through the Opstrace UI (although the CLI handles key management). Because tenants are lightweight and useful, you can easily create and destroy them at will.
* * *
Many teams across the industry have built successful home-grown multi-tenant systems that share characteristics of what we’ve described. Opstrace is on a mission to build the open source observability distribution that makes all of this toilsome orchestration easy right out of the box. So if you haven’t built one yourself already, check out Opstrace—start with our quick start and then try adding a tenant.
[1] Kubernetes resources deployed in a single tenant on a 3-node Opstrace instance.
Generally speaking, we consider the underlying Kubernetes to be an implementation detail that is encapsulated by our user interface, so it technically could change in the future. However, for clarity, we show here all of the nearly 40 Kubernetes resources [1] provisioned for each tenant on a 3-node instance (more would be provisioned for larger Opstrace instances).
Note: Grafana unified alerting uses existing Loki and Cortex datasources to also read/write alerts and rules. Our datasource splitters ensure that Loki/Cortex rules/alerts requests from Grafana are routed to the respective ruler components and all other queries are routed to the query-frontend components
$ kubectl get all --namespace prod-tenantNAME READY STATUS RESTARTS AGEpod/cortex-api-7456cc6788-8h7rv 1/1 Running 0 5dpod/cortex-api-7456cc6788-w9fb4 1/1 Running 0 5dpod/dd-api-586fdf5bcc-nht2d 1/1 Running 0 5dpod/dd-api-586fdf5bcc-v25f7 1/1 Running 0 5dpod/grafana-54f5bd74f8-gwclq 1/1 Running 0 8dpod/grafana-datasource-splitter-cortex-5fbcfd6f5b-qpgqm 1/1 Running 0 8dpod/grafana-datasource-splitter-loki-88c5f5b88-mxthw 1/1 Running 0 8dpod/loki-api-7f644df474-gm8b2 1/1 Running 0 5dpod/loki-api-7f644df474-rkdtx 1/1 Running 0 5dpod/prometheus-prod-prometheus-0 2/2 Running 1 8dNAME TYPE CLUSTER-IP EXTERNAL-IP PORT(S) AGEservice/cortex-alertmanager ExternalName <none> alertmanager.cortex.svc.cluster.local <none> 8dservice/cortex-api ClusterIP 10.100.253.197 <none> 8080/TCP 8dservice/dd-api ClusterIP 10.100.38.42 <none> 8080/TCP 8dservice/grafana ClusterIP 10.100.86.2 <none> 3000/TCP 8dservice/grafana-datasource-splitter-cortex ClusterIP 10.100.225.66 <none> 80/TCP 8dservice/grafana-datasource-splitter-loki ClusterIP 10.100.47.180 <none> 80/TCP 8dservice/loki-api ClusterIP 10.100.136.95 <none> 8080/TCP 8dservice/prometheus ClusterIP 10.100.235.170 <none> 9090/TCP 8dservice/prometheus-operated ClusterIP None <none> 9090/TCP 8dNAME READY UP-TO-DATE AVAILABLE AGEdeployment.apps/cortex-api 2/2 2 2 8ddeployment.apps/dd-api 2/2 2 2 8ddeployment.apps/grafana 1/1 1 1 8ddeployment.apps/grafana-datasource-splitter-cortex 1/1 1 1 8ddeployment.apps/grafana-datasource-splitter-loki 1/1 1 1 8ddeployment.apps/loki-api 2/2 2 2 8dNAME DESIRED CURRENT READY AGEreplicaset.apps/cortex-api-6bb6657f9 0 0 0 8dreplicaset.apps/cortex-api-7456cc6788 2 2 2 5dreplicaset.apps/dd-api-586fdf5bcc 2 2 2 5dreplicaset.apps/dd-api-d5cffcdcd 0 0 0 8dreplicaset.apps/grafana-54f5bd74f8 1 1 1 8dreplicaset.apps/grafana-datasource-splitter-cortex-5fbcfd6f5b 1 1 1 8dreplicaset.apps/grafana-datasource-splitter-loki-88c5f5b88 1 1 1 8dreplicaset.apps/loki-api-567b9dcd7f 0 0 0 8dreplicaset.apps/loki-api-7f644df474 2 2 2 5dNAME READY AGEstatefulset.apps/prometheus-prod-prometheus 1/1 8d